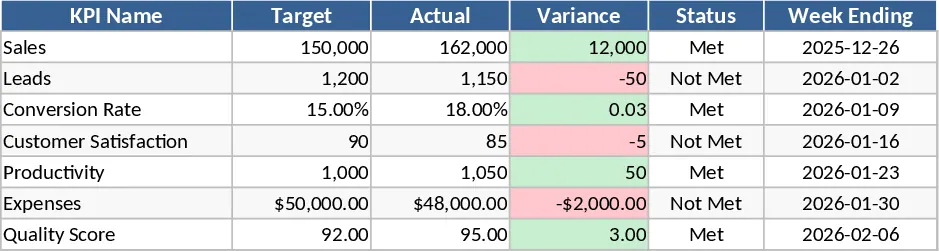
Project Dashboard Template
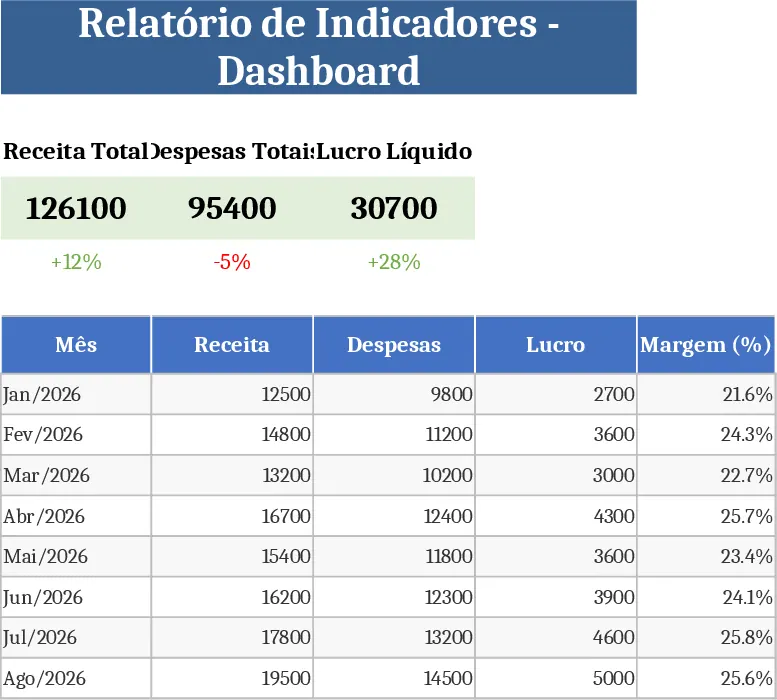
This analytics dashboard template is organized into three main sheets: Data Input, Metrics, and Dashboard. In the Data Input sheet you paste or import raw data – sales figures, website traffic, project hours, or any numeric series – and the template automatically validates entries using dropdowns and data‑type checks. The Metrics sheet calculates core KPIs such as totals, averages, growth rates, and ratios with built‑in formulas, while the Dashboard sheet pulls those results into clean, interactive charts, sparklines, and summary tables that update instantly as the source data changes.
The template solves the common problem of manually building reports from scratch. Instead of spending hours designing charts, writing formulas, and aligning layouts, you get a polished, ready‑made view of your most important numbers. It speeds up weekly or monthly reporting cycles, ensures consistency across team members, and makes it easy to spot trends or outliers at a glance. Whether you’re a marketing analyst tracking campaign ROI, a finance officer monitoring cash flow, or a project manager reviewing resource utilization, this dashboard gives you a single, visual snapshot of performance.
It is ideal for analysts, managers, and small‑team leaders who need to turn raw data into actionable insights without deep Excel expertise. Use it when you have periodic data (daily, weekly, monthly) that you want to visualize quickly, or when you need to share a concise performance report with stakeholders who prefer charts over raw tables.
How to use
- Open the Data Input sheet and paste your dataset into the predefined columns; select the appropriate category from the dropdowns if needed.
- Switch to the Metrics sheet – the template will automatically compute totals, averages, and any custom ratios you’ve set up.
- Go to the Dashboard sheet to see the updated charts and summary tables; you can filter views using the slicers at the top.
- Export the dashboard as a PDF or share the workbook; the visualizations stay linked to the latest data.
Expected benefits: you’ll cut report‑building time dramatically, reduce manual calculation errors, and gain a clear visual overview of key metrics that helps you make faster, data‑driven decisions.
Similar Templates Recommendation
Business Dashboard Template
A customizable analytics dashboard template that lets you consolidate key metrics, visualize trends, and monitor performance at a glance.
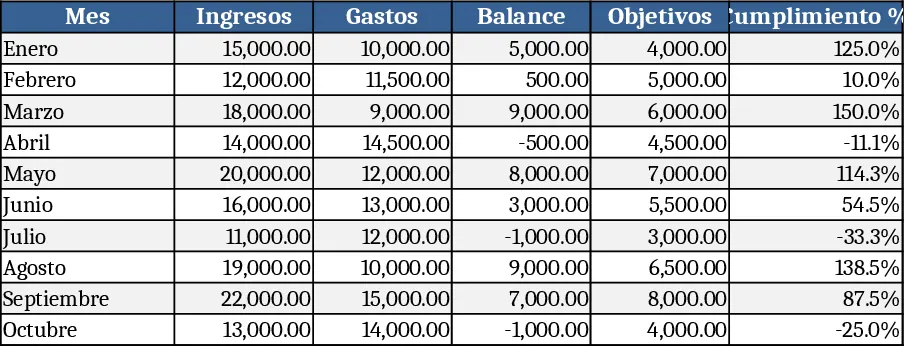
Leadership Weekly Metrics Tracker Template
A ready‑to‑use Excel workbook that lets you capture weekly leadership KPIs, view dynamic dashboards and track trends without needing any downloads.

Weekly KPI Tracker Template
Monitor your team's weekly performance metrics and visualize progress against targets with this comprehensive KPI tracking dashboard.