Social Media Data Dashboard Template
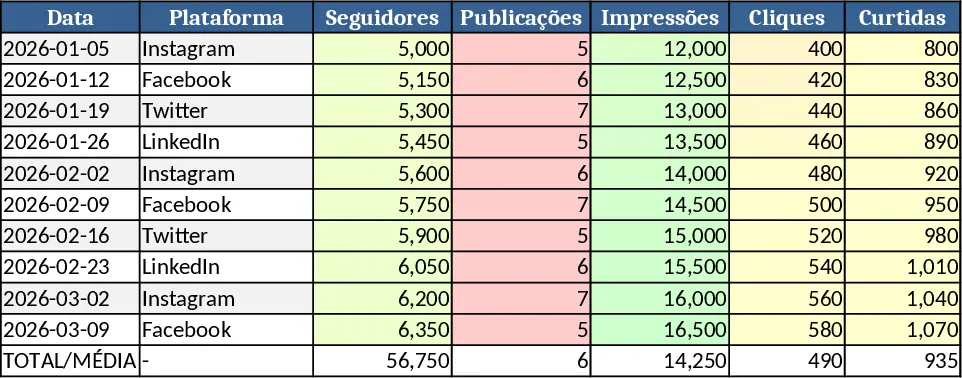
The Social Media Data Dashboard template is built on a simple three‑sheet structure. The Data Input sheet lets you paste raw export files from Facebook, Instagram, Twitter, LinkedIn or any other platform. Columns are pre‑named (Date, Platform, Post ID, Reach, Impressions, Likes, Comments, Shares, Click‑throughs, Followers Gained) and include data‑validation dropdowns for Platform so you stay consistent. The Metrics sheet automatically aggregates the raw rows, calculating daily, weekly and monthly totals, growth rates, engagement ratios (likes + comments + shares ÷ reach) and follower trends. Finally, the Dashboard sheet pulls those calculations into ready‑made charts – line graphs for follower growth, bar charts for top‑performing posts, pie charts for platform share, and a KPI summary box that highlights the most important numbers at a glance.
This template solves the common headache of juggling multiple CSV files and manually building reports. Instead of spending hours cleaning data and recreating charts each week, you get a single, up‑to‑date view of how your content is resonating. It helps you spot spikes, compare platform performance, and make data‑driven decisions about publishing schedules, content types, and paid promotion allocation. The visual summary also makes it easy to share results with managers or clients without exporting separate files.
The primary users are social media managers, digital marketers, content creators and small‑business owners who need a quick, reliable way to monitor their online presence. It works best for weekly or monthly reporting cycles, campaign performance reviews, and quarterly strategy sessions. Whether you manage a single brand or several accounts, the template scales by simply adding more rows to the Data Input sheet.
How to use
- Open the Data Input sheet and paste your platform export files; use the Platform dropdown to label each row.
- Verify that dates are in the correct format and that numeric fields contain numbers – the template will flag any errors.
- Switch to the Dashboard sheet; the charts and KPI box update automatically based on the new data.
- If you need a custom view, add a filter or slicer on the Metrics sheet to focus on a specific date range or platform, then refresh the dashboard.
Expected benefits: you’ll cut reporting time dramatically, reduce manual errors, and gain clearer insight into what content drives engagement, freeing you to focus on strategy rather than spreadsheet gymnastics.
Similar Templates Recommendation
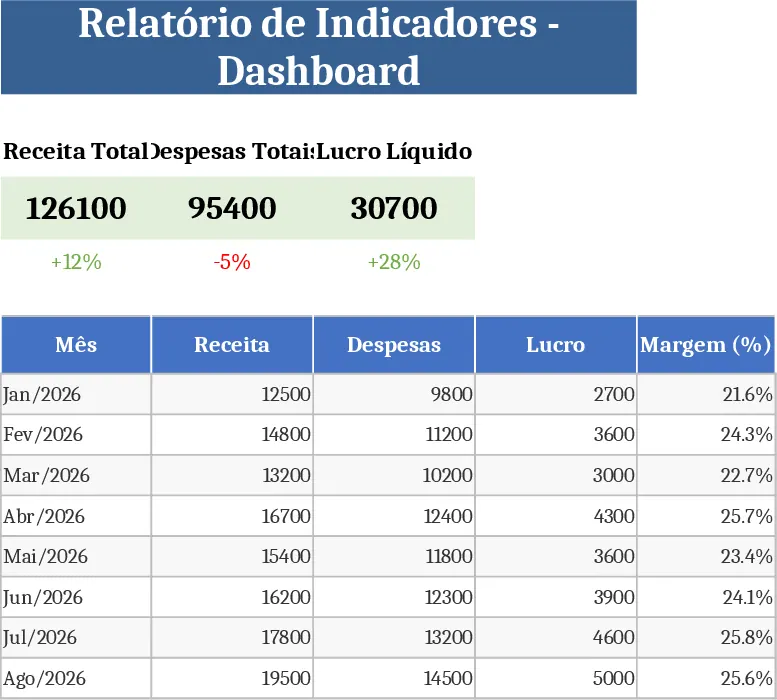
Business Dashboard Template
A customizable analytics dashboard template that lets you consolidate key metrics, visualize trends, and monitor performance at a glance.
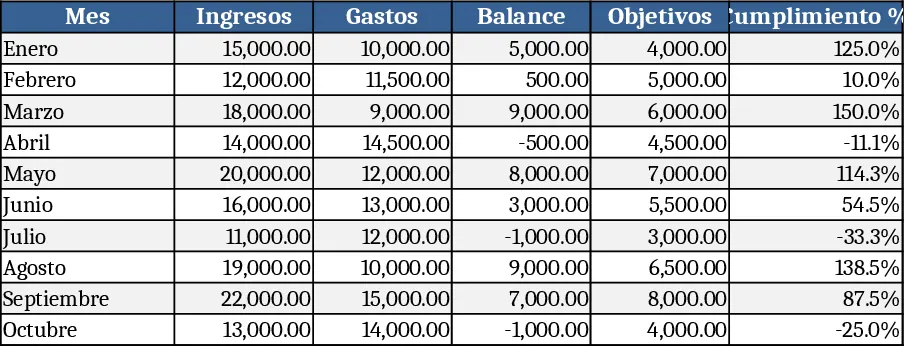
Calculation and Summary Report Template
A versatile Excel template that lets you input raw data, run calculations, and instantly generate clear summary tables and charts.
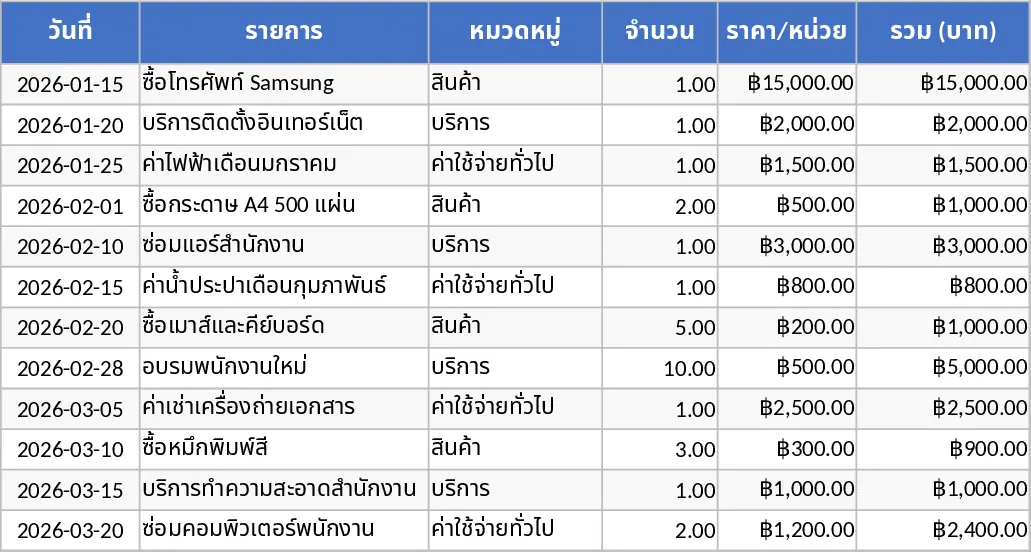
Project Dashboard Template
A ready‑to‑use analytics dashboard template that lets you import data, view key performance indicators, and track trends with interactive charts and summary tables.