

MINEDU Peru Social Sciences Diagnostic Evaluation Heat Map Template
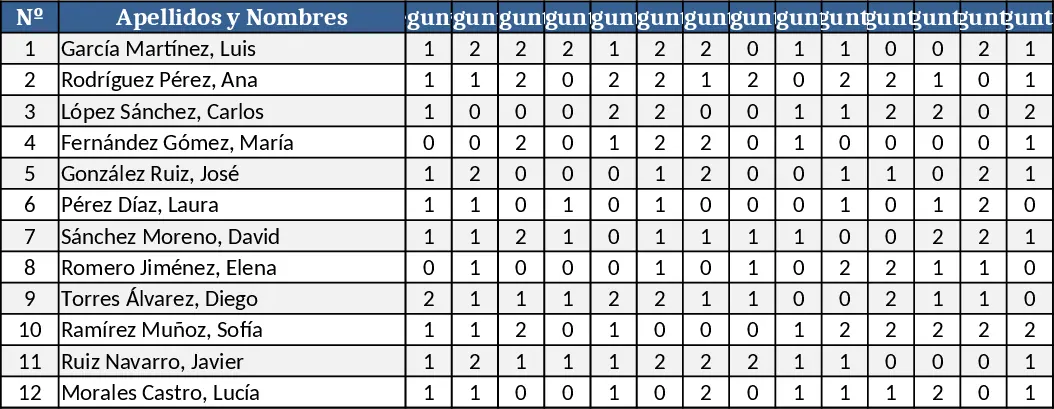
This template lets teachers quickly capture, score and visualise the results of a 30‑question diagnostic test in Social Studies, following the MINEDU Peru framework. The workbook is split into three sheets: Responses, where you enter each student’s answers to the 30 items (10 per competency); Scoring, which automatically converts each answer to 2 points, aggregates totals per competency and overall; and Dashboard, which displays a colour‑coded heat‑map of performance by competency, plus bar and line charts that highlight strengths, gaps and trends across the class.
The tool solves the common headache of manually tallying scores and creating visual reports after a diagnostic exam. By automating the calculation and providing ready‑made graphics, you save time, reduce errors and get an instant picture of where students stand. This is especially useful for teachers preparing remedial plans, school coordinators monitoring curriculum coverage, or education officers reporting to MINEDU.
Anyone who needs to evaluate baseline knowledge in Social Studies – primary or secondary teachers, curriculum designers, school administrators – will find this template handy. It helps you track individual and group performance, compare competencies, and communicate results to stakeholders with clear, colour‑rich visuals.
How to use
- Open the Responses sheet and type each student’s name in column A. Fill columns B‑AE with the 30 answers (use the drop‑down list of "Correct" / "Incorrect" or simply enter 1/0).
- Switch to the Scoring sheet; the template automatically assigns 2 points per correct answer, sums points per competency and calculates the total score. Review any flagged cells for missing data.
- Go to the Dashboard sheet – the heat‑map updates instantly, showing green for high scores and red for low scores. The accompanying bar chart breaks down average points per competency, while the line chart tracks class performance over multiple test dates (if you copy the sheet for later rounds).
- Export the charts as images or print the dashboard to share with students, parents or education officials.
Expected benefits: faster grading, instant visual insights, and a professional‑looking report without needing separate charting software.
Similar Templates Recommendation
Secondary School Results and Ranking Template
Track up to 200 secondary students' marks, auto‑calculate grades, averages, divisions and rankings in a clear, formatted sheet.

Couple Budget and Cash Flow Tracker Template
Track monthly income, expenses, and cash flow for a working couple, visualize budgets and savings goals in one spreadsheet.

Date Range and Internal Log Template
Create an Excel file with two columns for dates and internal notes, with colored rows for different date ranges.
