

Chicken Production Cost Tracker Template
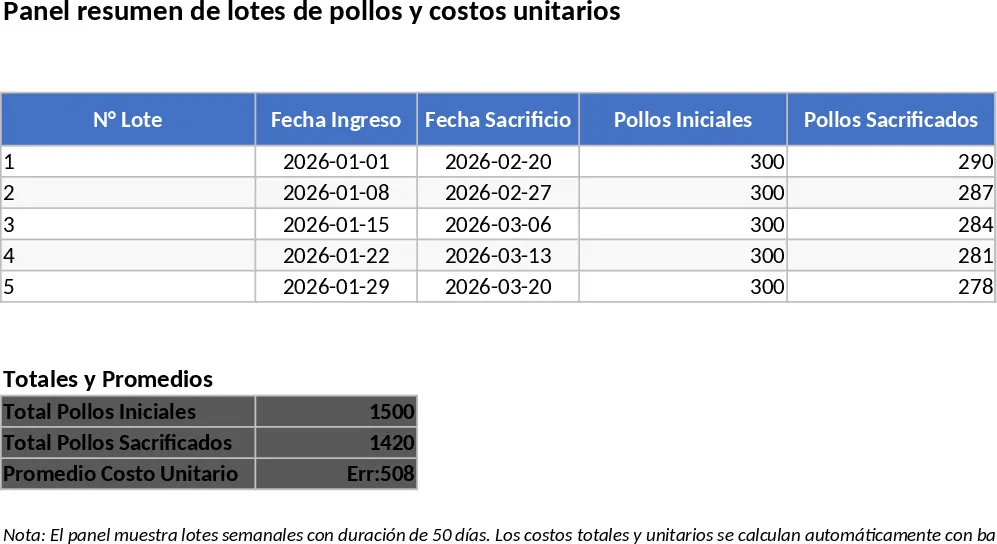
This Excel template is built for poultry producers who need a clear view of their production expenses. It contains three main sheets: Input, Cost Breakdown, and Summary. In the Input sheet you record the week’s start date, the number of chickens received (e.g., 300), the unit purchase price (e.g., 3,400), and any additional costs such as feed, labor, utilities, and veterinary fees. The Cost Breakdown sheet automatically allocates those variable costs to each bird, while the Summary sheet aggregates the data, showing total weekly cost, average cost per bird, cumulative totals, and a simple line chart that visualizes cost trends over time. Dropdown lists let you select cost categories, and conditional formatting highlights unusually high expenses.
The template solves the common problem of scattered spreadsheets and manual calculations that waste time and lead to errors. By centralising all cost inputs in one place, you can instantly see how each factor impacts the overall cost per chicken, enabling smarter pricing decisions and tighter budget control. It also helps you spot cost spikes early—if feed prices rise, the per‑bird cost will reflect that immediately, prompting you to adjust feed strategies or negotiate better rates.
Ideal for small‑to‑medium poultry farms, farm managers, and agribusiness accountants, the tool fits any scenario where weekly batches of birds are purchased and processed. Whether you run a free‑range operation or a conventional broiler house, the template adapts to your cost structure and gives you a reliable snapshot of profitability.
How to use
- Enter the week’s start date, number of chickens, and unit purchase price in the Input sheet.
- Fill in any additional expense fields (feed, labor, utilities, etc.) for that week.
- Switch to the Summary sheet to view automatically calculated totals, per‑bird cost, and trend charts.
- Adjust or add new cost categories using the dropdowns; the formulas will update the breakdown instantly.
Expected benefits include a significant reduction in time spent on manual cost calculations and a clearer, data‑driven picture of your production expenses, helping you make faster, more informed decisions about pricing, budgeting, and cost‑saving measures.
Similar Templates Recommendation
Secondary School Results and Ranking Template
Track up to 200 secondary students' marks, auto‑calculate grades, averages, divisions and rankings in a clear, formatted sheet.

Couple Budget and Cash Flow Tracker Template
Track monthly income, expenses, and cash flow for a working couple, visualize budgets and savings goals in one spreadsheet.

Date Range and Internal Log Template
Create an Excel file with two columns for dates and internal notes, with colored rows for different date ranges.
