

Project Budget BFU with Budget, Actuals & Summary Template
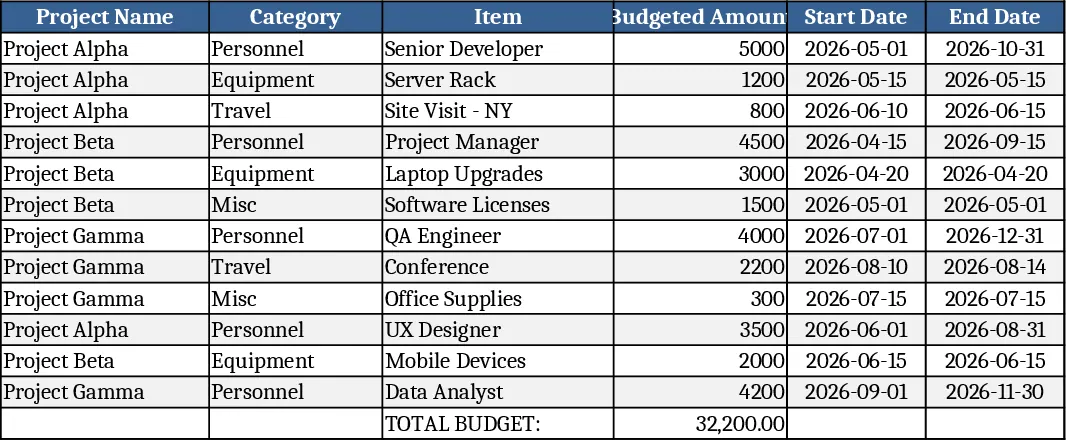
This template is built around three interconnected worksheets – Budget, Actuals, and Summary – to give you a single source of truth for every project's financial health. In the Budget sheet you list each cost category, planned amount, start and end dates, and optional dropdowns for department or cost‑center codes. The Actuals sheet mirrors the same categories and lets you log real‑time spend, invoice dates, and notes, with data validation to keep entries consistent. Both sheets feed a Summary dashboard that automatically calculates variance, cumulative spend, and percentage of budget used, and visualises the results with simple bar and pie charts.
The template solves the common headache of juggling separate files for planned versus actual spend, eliminating manual reconciliation and reducing the risk of overspending. By keeping everything linked, you instantly see where a project stands against its financial targets, enabling quicker corrective actions and more accurate forecasting. It’s especially valuable for project managers, finance analysts, and PMO teams who need to report budget status to stakeholders on a weekly or monthly cadence.
With this tool you can track planned versus actual costs, monitor cash‑flow timing, and produce a clean, printable summary for executive reviews. The built‑in variance alerts highlight categories that exceed a configurable threshold, helping you focus attention where it matters most. Because the sheets are pre‑formatted with dropdowns and protected cells, team members can safely enter data without breaking formulas, ensuring the summary remains reliable.
How to use
- Open the Budget sheet and fill in each line item: cost description, planned amount, start/end dates, and select the appropriate department from the dropdown.
- Switch to the Actuals sheet and record every expense as it occurs, matching the cost description to the budget line and entering the actual amount and invoice date.
- The Summary sheet updates automatically – review the variance column, total spend, and the visual charts to see overall performance.
- If needed, adjust the variance threshold in the Settings section to trigger custom alerts for overspend.
Expected benefits include faster month‑end close, fewer manual calculations, and clearer insight into project financial performance, freeing up time for strategic decision‑making.
Similar Templates Recommendation
Secondary School Results and Ranking Template
Track up to 200 secondary students' marks, auto‑calculate grades, averages, divisions and rankings in a clear, formatted sheet.

Couple Budget and Cash Flow Tracker Template
Track monthly income, expenses, and cash flow for a working couple, visualize budgets and savings goals in one spreadsheet.

Date Range and Internal Log Template
Create an Excel file with two columns for dates and internal notes, with colored rows for different date ranges.
