

Investment vs Tender Value Dashboard and 3-Year Projection Template
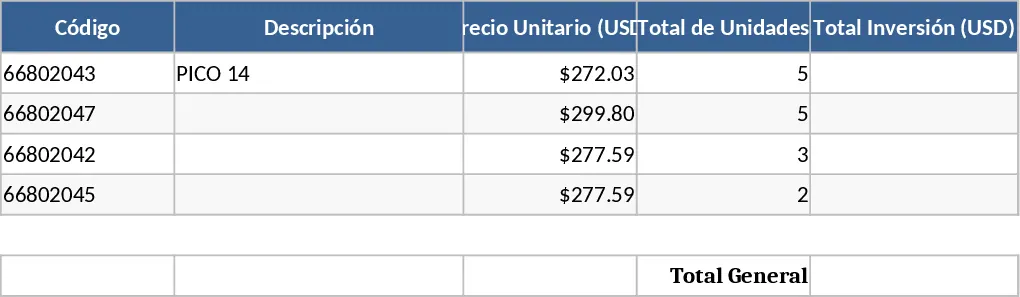
This specialized Dashboard for Sample Investment vs. Tender Value is an essential strategic tool for businesses engaged in competitive bidding and procurement processes. In many industries, such as medical supplies, construction, or high-tech manufacturing, providing physical samples is a mandatory and often expensive part of the tender process. This template allows you to meticulously track these upfront costs and weigh them against the projected revenue of a three-year contract, ensuring that every bid you submit is financially viable and strategically sound. By visualizing the relationship between what you spend to enter a bid and what you stand to gain, you can optimize your sales resources and focus on the most profitable opportunities.
The template is structured into three primary components: an Investment Detail sheet, a Multi-Year Projection engine, and a Visual Analytics Dashboard. In the Investment section, you can input granular data for specific items, such as the PICO 14 series (including codes like 66802043, 66802047, and 66802042), their unit prices, and the total units sacrificed for the sampling phase. This level of detail ensures that no hidden costs are overlooked. The Projection engine then takes these inputs and applies them to a three-year sales forecast. For instance, if you start with a base of 75 units per year for each code and scale up to 125 units by the third year, the template automatically calculates the gross tender value, allowing you to see the trajectory of your potential return on investment over time.
This tool is particularly beneficial for Sales Directors, Account Managers, and Financial Analysts who need to present a clear business case for tender participation. It solves the common problem of bidding blind, where companies win contracts only to realize later that the cost of acquisition—including samples, logistics, and administrative overhead—was too high relative to the margins. By using this dashboard, you can identify the most lucrative opportunities and allocate your sampling budget more effectively. The automated charts provide a clear visual representation of the Investment vs. Reward ratio, making it easy to communicate the value of a bid to executive stakeholders or board members during internal reviews.
Beyond simple calculations, the template helps you manage the lifecycle of a bid by allowing for sensitivity analysis. You can track how changes in unit pricing or volume growth impact your bottom line over the three-year horizon. The inclusion of specific fields for product codes and unit costs means you can use this for a wide variety of inventory-heavy tenders. Whether you are dealing with a small-scale local contract or a massive multi-year government tender, the logic remains consistent: protect your margins by understanding your entry costs. The dashboard summarizes these complex data points into easy-to-read KPIs, such as total investment cost, total projected revenue, and the break-even timeline.
How to use this template:
- Open the Investment Detail sheet and enter your specific product codes, unit prices, and the number of samples required for the bid to calculate your total upfront cost.
- Navigate to the Projection sheet to input your expected annual volumes for each item; for example, set the starting quantity at 75 units for Year 1 and increase it to 125 units by Year 3 to see the revenue growth.
- Review the Dashboard sheet to analyze the generated charts, which compare the total sample investment against the cumulative 3-year tender value and highlight your profit margins.
- Use the summary metrics to determine the ROI and decide whether to proceed with the bidding process or adjust your pricing strategy to ensure long-term profitability.
Expected benefits: Enhanced financial oversight of the bidding process and a significant reduction in the time required to generate professional sales projections and cost-benefit reports.
Similar Templates Recommendation
Secondary School Results and Ranking Template
Track up to 200 secondary students' marks, auto‑calculate grades, averages, divisions and rankings in a clear, formatted sheet.

Couple Budget and Cash Flow Tracker Template
Track monthly income, expenses, and cash flow for a working couple, visualize budgets and savings goals in one spreadsheet.

Date Range and Internal Log Template
Create an Excel file with two columns for dates and internal notes, with colored rows for different date ranges.
