

Computer System Elements Mapping & Functions Template
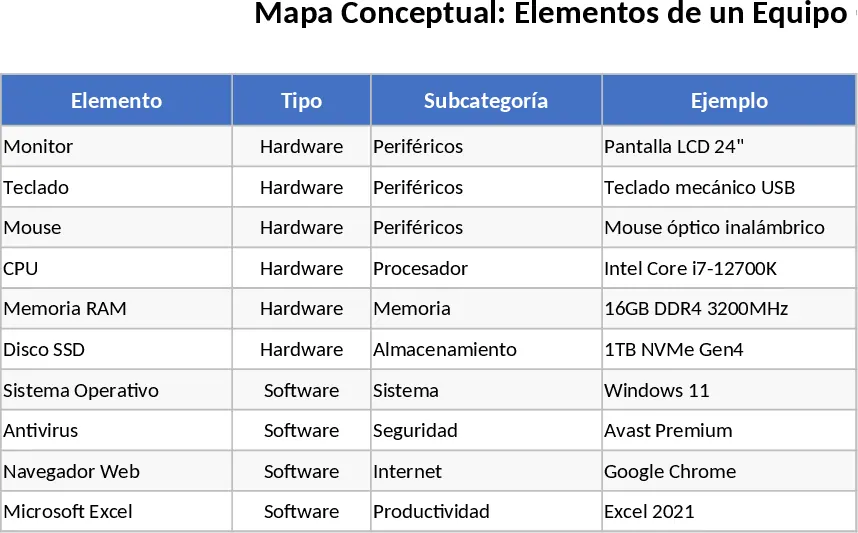
This template lets you build a clear, visual map of all the elements that make up a computer system—both hardware (CPU, RAM, storage, peripherals) and software (OS, drivers, applications). The workbook is split into three sheets: Components List, where you enter each item with its category, specifications, and optional cost; Conceptual Map, a matrix that lets you link hardware to software using dropdowns, automatically generating a network diagram on the same sheet; and Function Lab, where you plug in data and use built‑in statistical, mathematical, trigonometric, and financial formulas to solve real‑world problems such as performance budgeting, cost‑benefit analysis, or algorithmic calculations. Summary charts on the dashboard sheet instantly show relationships, total costs, and key metrics.
Designed for teachers, students, and IT trainers, the workbook bridges theory and practice. It solves the common classroom challenge of explaining abstract computer architecture while simultaneously reinforcing spreadsheet skills. By visualising how each component interacts and then applying quantitative functions, learners can see the direct impact of hardware choices on software performance and financial outcomes, turning a static lecture into an interactive lab.
The template helps you track every element of a computer setup, manage their interdependencies, and produce actionable insights. Whether you’re preparing a lesson on system design, evaluating upgrade scenarios, or teaching spreadsheet formulas, you’ll have a ready‑made framework that captures data, visualises connections, and runs calculations without manual charting.
How to use
- Step 1: Open the Components List sheet and fill in each hardware and software item, selecting the appropriate category from the dropdown and entering specs like speed, capacity, or license cost.
- Step 2: Switch to the Conceptual Map sheet, choose items from the two dropdown columns to define relationships (e.g., CPU ↔ Operating System). The sheet auto‑generates a flow diagram and updates link counts.
- Step 3: Go to the Function Lab sheet, enter the numeric values you want to analyse (e.g., power consumption, purchase price) and select the desired function from the list (AVERAGE, SUM, SIN, PMT, etc.). The formulas compute results instantly.
- Step 4: Review the Dashboard sheet for visual summaries: a network graph of component connections, a cost breakdown pie chart, and key statistical tables.
Expected benefits: You’ll spend far less time drawing diagrams by hand, get instant feedback on how component choices affect performance and budget, and reinforce spreadsheet competencies through hands‑on problem solving.
Similar Templates Recommendation
Secondary School Results and Ranking Template
Track up to 200 secondary students' marks, auto‑calculate grades, averages, divisions and rankings in a clear, formatted sheet.

Couple Budget and Cash Flow Tracker Template
Track monthly income, expenses, and cash flow for a working couple, visualize budgets and savings goals in one spreadsheet.

Date Range and Internal Log Template
Create an Excel file with two columns for dates and internal notes, with colored rows for different date ranges.
