

Batch and Complaint Data Model with Reason Lookup Template
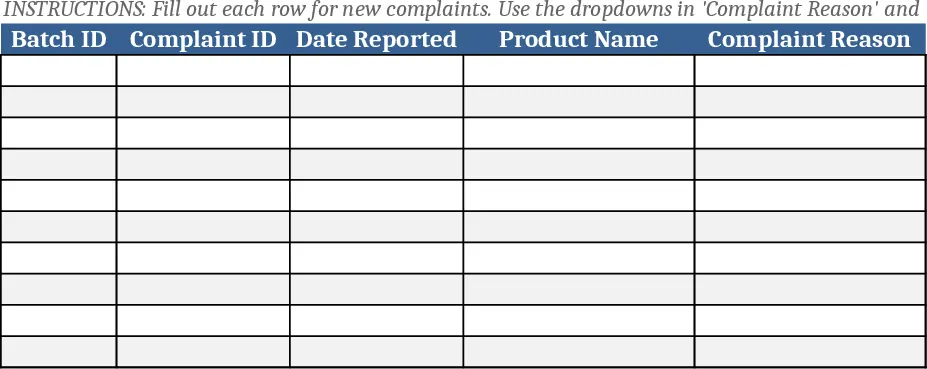
This Excel template builds a Power‑BI‑style dashboard that lets quality managers monitor every incoming batch from raw and packaging materials. The workbook contains separate sheets for the main batch log, complaint records, reject reasons and complaint reasons, all linked through a unique Batch table that removes duplicate shipments. Helper columns add month, year and a complaint flag, while Power Query creates the data model and relationships so that slicers and pivot tables always reflect the latest data. KPI cards display total unique batches, reject %, exception %, complaint rate and PPM, and the dashboard also shows supplier rankings, monthly trend lines and Pareto charts for reject, exceptional and complaint reasons.
The solution solves the common pain of double‑counting shipments, mixing decision and complaint dimensions, and manually aggregating root‑cause data. By consolidating everything at the batch level, you get accurate percentages, a clear view of which suppliers or materials generate the most issues, and a composite score that balances incoming quality with in‑process performance. The template is ideal for quality managers, supply‑chain analysts and production supervisors who need to spot problem trends quickly, justify corrective actions and communicate supplier performance to stakeholders without building a separate BI system.
How to use the dashboard:
- Import your raw material, packaging material and complaint files into the "Data Import" sheet; Power Query will clean, deduplicate shipments and create the unique Batch table.
- Fill the reason tables with standardized codes – the template supports multiple reasons per batch or complaint and automatically aggregates frequencies.
- Use the slicers at the top of the dashboard to filter by supplier, material or date range; the KPI cards, trend charts and Pareto visuals update instantly.
- Review the Supplier Score and PPM cards to rank suppliers, then drill down through the Pareto charts to identify the top reject or complaint causes and plan corrective actions.
Expected benefits include a dramatic reduction in manual spreadsheet work, consistent batch‑level reporting and faster insight into supplier performance, helping you allocate quality resources more effectively.
Similar Templates Recommendation
Secondary School Results and Ranking Template
Track up to 200 secondary students' marks, auto‑calculate grades, averages, divisions and rankings in a clear, formatted sheet.

Couple Budget and Cash Flow Tracker Template
Track monthly income, expenses, and cash flow for a working couple, visualize budgets and savings goals in one spreadsheet.

Date Range and Internal Log Template
Create an Excel file with two columns for dates and internal notes, with colored rows for different date ranges.
