

Student Assignment Tracker with Grade Chart Template
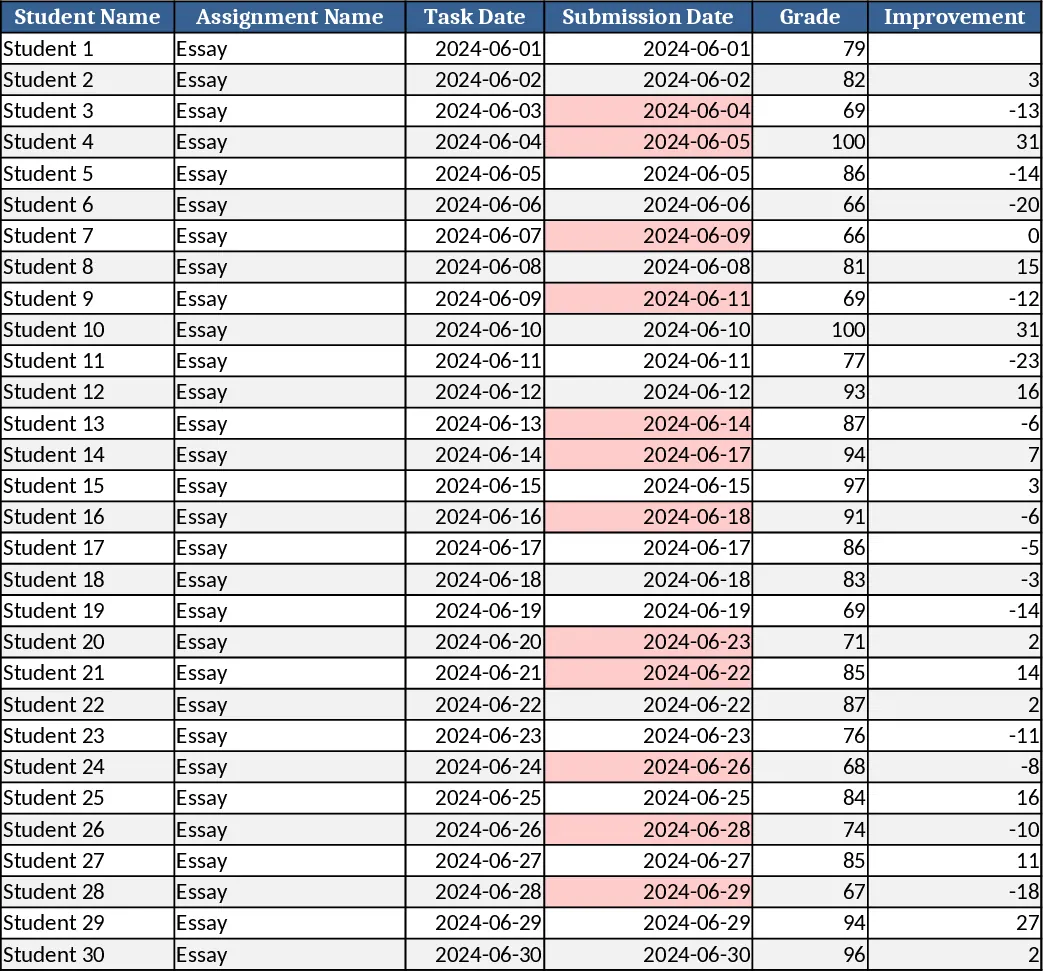
This template is organized into three clear tabs – Assignments, Summary, and Dashboard. In the Assignments sheet you record each entry with fields for Student Name, Assignment Title, Due Date, Submission Date, Grade (selectable from a dropdown list), and optional Comments. Dates are entered via Excel’s date picker, and grades can follow any scale you prefer. The Summary sheet automatically aggregates the data, calculating each student’s average, total points, and improvement index using simple formulas. Finally, the Dashboard sheet pulls the summary numbers into a dynamic chart that plots grades over time, letting you and your students instantly see performance trends.
The template solves the common headache of juggling spreadsheets, email reminders, and manual grade calculations. By centralizing all assignment information, it eliminates duplicate entry and reduces the risk of missing deadlines. The auto‑generated statistics give you a quick snapshot of class‑wide progress, while the visual chart makes it easy to spot who is improving, who may need extra help, and how the overall cohort is performing. This insight supports data‑driven discussions during parent‑teacher meetings and helps you allocate instructional time more effectively.
Designed for teachers, tutors, academic coordinators, and even homeschooling parents, the sheet works for any class size where regular assignments are given – from small study groups to full‑size high‑school classes. Whether you’re tracking weekly quizzes, project milestones, or homework submissions, the template adapts to your grading rubric and schedule, making it a versatile tool for everyday classroom management.
How to use
- Open the Assignments tab and enter each student’s assignment details, using the date picker for due and submission dates and the grade dropdown for scores.
- Verify that all dates are in the correct format; the sheet will flag any inconsistencies automatically.
- Switch to the Summary tab – the averages, totals, and improvement metrics will populate instantly based on your entries.
- Go to the Dashboard tab to view the grade‑over‑time chart; you can filter by student or assignment type to focus on specific trends.
Expected benefits: You’ll spend far less time compiling grades manually and get instant visual insight into each student’s progress, freeing up more time for teaching and feedback.
Similar Templates Recommendation
Secondary School Results and Ranking Template
Track up to 200 secondary students' marks, auto‑calculate grades, averages, divisions and rankings in a clear, formatted sheet.

Couple Budget and Cash Flow Tracker Template
Track monthly income, expenses, and cash flow for a working couple, visualize budgets and savings goals in one spreadsheet.

Date Range and Internal Log Template
Create an Excel file with two columns for dates and internal notes, with colored rows for different date ranges.
