

Colorful Client Visit Tracker Template
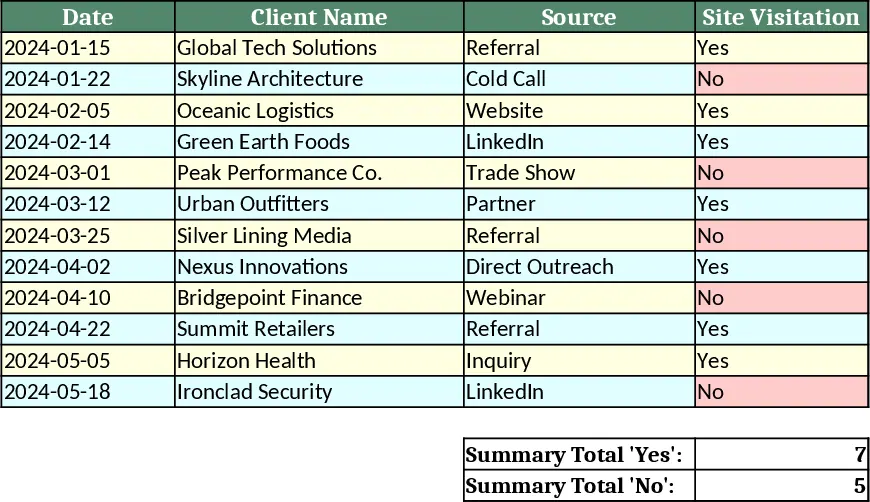
This Excel template is built as a single, eye‑catching workbook that makes recording client site visits both simple and visually appealing. The first sheet is a colorful dashboard where each row represents a visit, with columns for the visit date, client name, source of the lead, and a free‑form remarks field. Conditional formatting adds a splash of color—different shades highlight upcoming visits, completed trips, or overdue follow‑ups—so you can scan the list at a glance. A second sheet aggregates the data, automatically summarizing the number of visits per month, the most frequent client sources, and any recurring issues noted in the remarks. Drop‑down lists for "Source" (e.g., Referral, Marketing Campaign, Existing Account) keep entries consistent, while date pickers ensure proper date formatting.
The template solves the common headache of scattered notes and inconsistent reporting that sales teams often face after field visits. By centralizing all visit details in one place, it eliminates the need for separate emails, handwritten logs, or multiple files. The visual cues help managers quickly identify gaps in coverage or trends in client feedback, enabling faster decision‑making and more proactive relationship management. It’s especially useful for account executives, field sales reps, and regional managers who need to keep a tidy record of on‑site interactions without sacrificing style.
Who benefits most? Sales professionals who regularly travel to client locations, team leaders who monitor field activity, and anyone who wants a tidy, colorful overview of client engagement. The template helps you track when and where visits happen, who the client is, how the opportunity originated, and any key observations you captured on the spot. This organized view makes it easy to generate follow‑up plans, update CRM systems, or prepare summary reports for leadership.
How to use:
- Open the workbook and go to the "Visits Log" sheet. Enter each visit’s details in the highlighted row—pick the date from the calendar picker, select the client from the drop‑down list, choose the source, and type any remarks.
- As you add rows, the conditional colors will update automatically, flagging upcoming appointments in green and past visits in gray.
- Switch to the "Summary" sheet to see auto‑calculated totals, monthly visit counts, and source breakdowns. Adjust the date range filter at the top if you only want to view a specific period.
- Export the summary as a PDF or copy the data into your CRM with a single click on the "Export" button.
Expected benefits: you’ll spend less time hunting for notes, enjoy clearer visibility into field activity, and reduce the effort of manual reporting, all while working with a template that brightens your daily routine.
Similar Templates Recommendation
Secondary School Results and Ranking Template
Track up to 200 secondary students' marks, auto‑calculate grades, averages, divisions and rankings in a clear, formatted sheet.

Couple Budget and Cash Flow Tracker Template
Track monthly income, expenses, and cash flow for a working couple, visualize budgets and savings goals in one spreadsheet.

Date Range and Internal Log Template
Create an Excel file with two columns for dates and internal notes, with colored rows for different date ranges.
