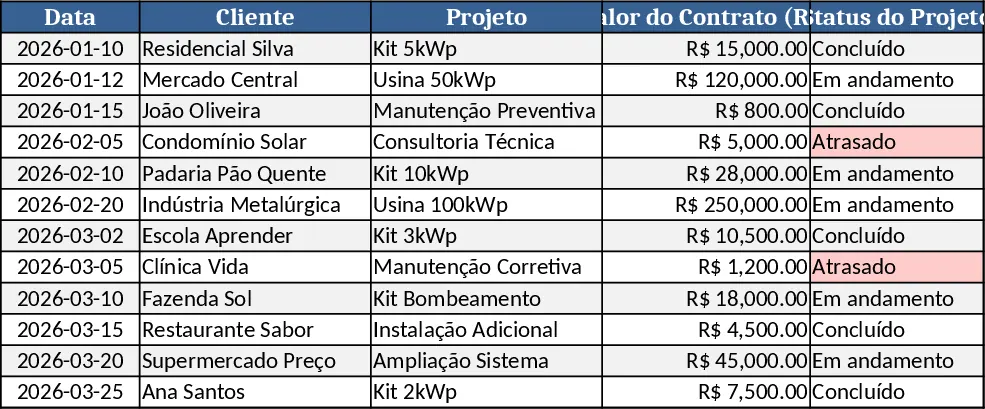
Sales KPI Tracker with YoY Growth Template
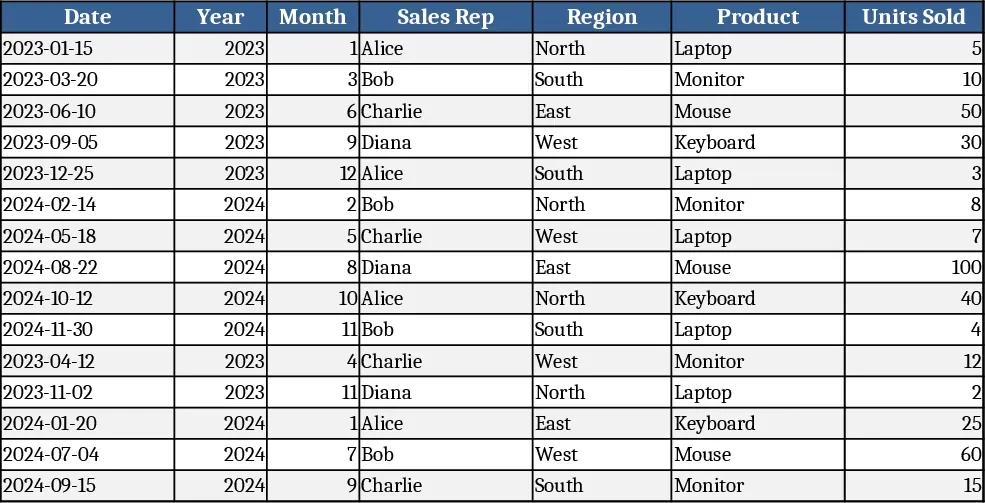
The template is organized into three worksheets: a Data Input sheet where you log each transaction (date, sales rep, region, product, units sold, revenue, and any discounts), a KPI Calculations sheet that pulls the raw data and computes core indicators such as total revenue, average deal size, win rate, and a built‑in year‑over‑year growth formula that compares the current period to the same period last year, and a Dashboard sheet that visualizes the results with bar charts, line trends, and conditional formatting for quick at‑a‑glance insights. Dropdown menus on the Input sheet standardize entries for region and product, while slicers on the Dashboard let you filter by rep, quarter, or product line.
This workbook eliminates the tedious manual work of copying numbers into separate reports and writing custom formulas for growth calculations. By consolidating raw sales data and automatically generating the YoY percentages, you get an instant view of whether your team is gaining traction or slipping, enabling faster, data‑driven decisions. The visual summary highlights top‑performing regions, products, and reps, helping you spot opportunities and address issues before they become critical.
Designed for sales managers, team leaders, and business analysts in small to mid‑size companies, the tracker fits any scenario where regular performance monitoring is required—monthly reviews, quarterly business reviews, or annual planning sessions. Whether you’re tracking a single product line or an entire portfolio, the template adapts through its flexible input fields and filter options.
With this tool you can monitor total sales, revenue per region, average order value, conversion rates, and the crucial year‑over‑year growth metric for each KPI. The Dashboard aggregates these numbers into concise charts and tables, giving you a clear picture of trends over time and the ability to export the summary for presentations.
How to use
- Open the Data Input sheet and enter each sale’s details; use the dropdowns for region and product to keep data consistent.
- Select the reporting period (month, quarter, or year) in the KPI sheet; the formulas automatically pull the matching records and calculate the growth figures.
- Switch to the Dashboard sheet to see updated charts and conditional highlights that reflect the latest data.
- If needed, adjust filters or slicers to focus on specific reps, regions, or product categories and export the view as PDF or copy it into a slide deck.
Expected benefits: you’ll spend far less time compiling reports, gain immediate insight into sales trends, and make more informed decisions with minimal effort.
Similar Templates Recommendation
Weekly KPI Tracker Template
Monitor your team's weekly performance metrics and visualize progress against targets with this comprehensive KPI tracking dashboard.
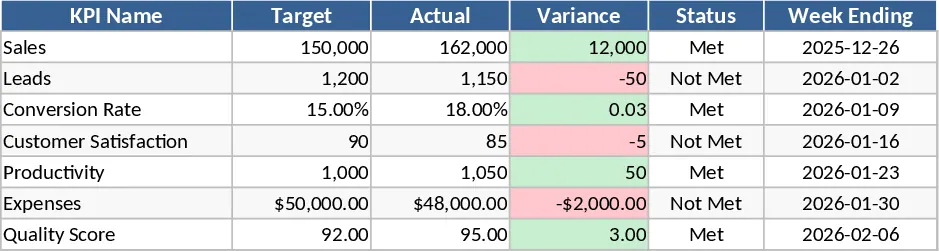
Employee Performance Review Template
Track, evaluate, and visualize employee performance metrics across periods with customizable scores and goals.
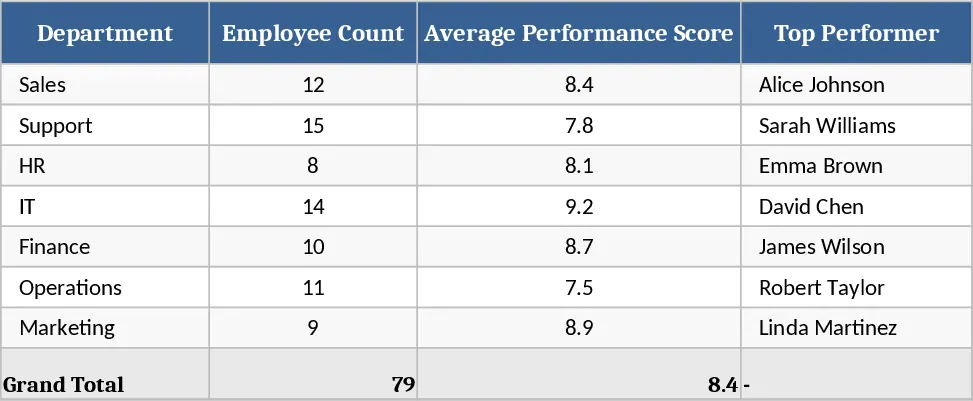
Solar Energy Financial & Operations Intelligence Dashboard Template
Professional Excel template to track and analyze solar energy projects' financials, costs, KPIs, and decision‑making dashboards.