

IPTV Customer Financial Dashboard Template
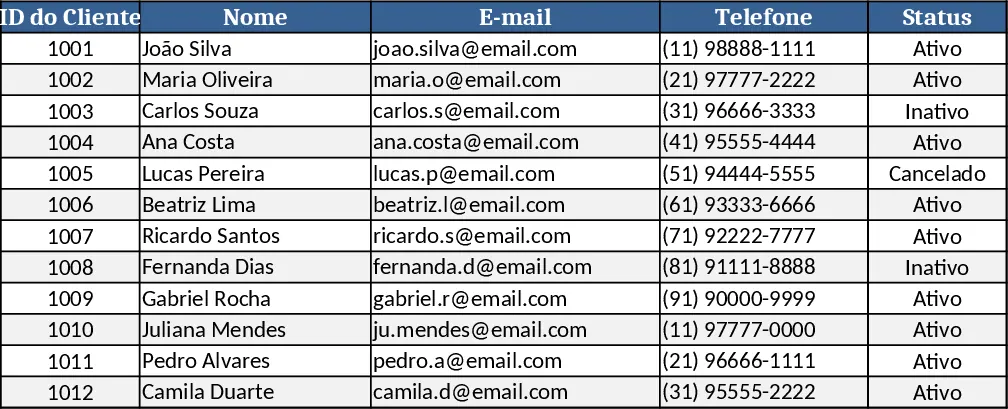
The IPTV Financial Dashboard is built as a single workbook with three main sheets: Data Input, Calculations, and Dashboard. In the Data Input sheet you list each client, their subscription plan, monthly fee, start date, and payment history. Drop‑down menus let you select plan types and payment status, while conditional formatting highlights overdue invoices. The Calculations sheet automatically aggregates totals, averages, and churn rates, creating pivot‑style tables that feed the visual Dashboard. The Dashboard sheet displays key metrics such as total monthly revenue, average revenue per user (ARPU), number of active vs. inactive clients, and a aging report of unpaid balances, all presented with charts and sparklines for quick insight.
This template solves the common headache of juggling multiple spreadsheets or manual reports to keep track of IPTV subscriber finances. By centralising client data and instantly generating financial summaries, you reduce the risk of missed payments, gain a clear view of cash flow, and can spot trends like rising churn before they become critical. The visual layout helps finance teams and account managers make data‑driven decisions, such as adjusting pricing, targeting retention campaigns, or planning budget allocations.
Ideal for IPTV service providers, billing specialists, and small‑to‑medium finance departments that need a fast, low‑cost way to monitor subscriber revenue. Whether you are preparing monthly management reports, reconciling bank statements, or evaluating the impact of a new pricing tier, this dashboard gives you the numbers you need without complex software.
How to use
- Open the Data Input sheet and fill in each client’s details: name, plan, monthly fee, start date, and payment dates. Use the provided drop‑downs for plan type and payment status.
- The Calculations sheet updates automatically; review the summary tables to ensure formulas capture all entries.
- Switch to the Dashboard sheet to see refreshed charts and key figures. Adjust the date filter at the top to view specific months or quarters.
- Export the Dashboard as PDF or copy charts into presentations for stakeholder meetings.
Expected benefits include faster month‑end close, fewer manual errors, and a clearer picture of revenue health, letting you focus on growth rather than spreadsheet maintenance.
Similar Templates Recommendation
Secondary School Results and Ranking Template
Track up to 200 secondary students' marks, auto‑calculate grades, averages, divisions and rankings in a clear, formatted sheet.

Couple Budget and Cash Flow Tracker Template
Track monthly income, expenses, and cash flow for a working couple, visualize budgets and savings goals in one spreadsheet.

Date Range and Internal Log Template
Create an Excel file with two columns for dates and internal notes, with colored rows for different date ranges.
