

Sales Target Tracker with Totals and Chart Template
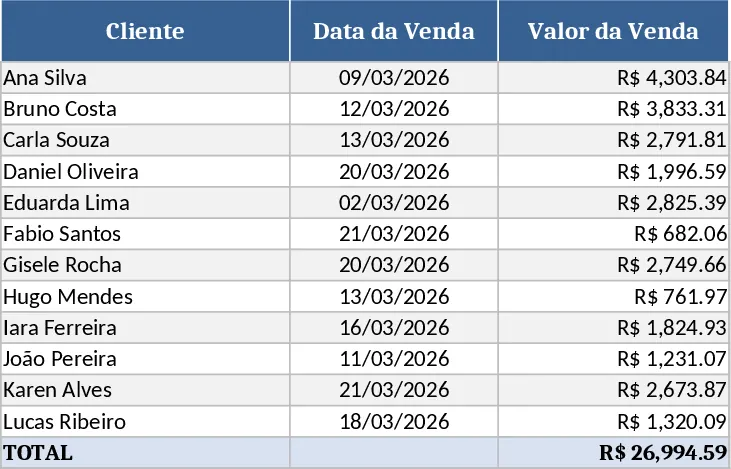
This template is built around two simple sheets. The Data Entry sheet holds a table where you record each transaction: Client Name, Sale Amount, and Date. At the top of the sheet you set your overall sales target for the period. Formulas automatically sum the amounts, calculate the cumulative total, and show the percentage of the target that has been reached. The second sheet, Summary & Chart, pulls those calculations into a clean dashboard. It displays the total sales, the remaining amount to hit the goal, and a dynamic bar/line chart that updates in real time as you add new rows.
The spreadsheet solves the common headache of manually aggregating daily sales and constantly checking whether you’re on track. By automating the summation and visualizing the data, you get instant insight into performance trends, can spot shortfalls early, and make data‑driven decisions about outreach or promotions. It’s especially useful for small‑business owners, sales representatives, and team leaders who need a quick, low‑cost way to monitor quotas without learning complex BI tools.
Anyone who needs to keep an eye on revenue targets benefits from this file – from solo freelancers tracking client invoices to regional sales managers overseeing a team’s monthly goals. The template helps you track each sale, monitor cumulative progress, and instantly see how far you are from the target, turning raw numbers into an actionable visual story.
How to use
- Open the workbook and enter your overall sales target in the highlighted cell on the Data Entry sheet.
- For every sale, fill in a new row with the client’s name, the amount sold, and the date of the transaction.
- Watch the totals and percentage fields update automatically; switch to the Summary sheet to see the chart reflect the new data.
- Use the chart to present progress in meetings or to motivate the team, adjusting strategies as needed.
Expected benefits: reduces manual calculation time, provides instant visual feedback on goal attainment, and helps keep the sales pipeline organized and transparent.
Similar Templates Recommendation
Secondary School Results and Ranking Template
Track up to 200 secondary students' marks, auto‑calculate grades, averages, divisions and rankings in a clear, formatted sheet.

Couple Budget and Cash Flow Tracker Template
Track monthly income, expenses, and cash flow for a working couple, visualize budgets and savings goals in one spreadsheet.

Date Range and Internal Log Template
Create an Excel file with two columns for dates and internal notes, with colored rows for different date ranges.
