Project Financial Scenario Modeling and Evaluation Template
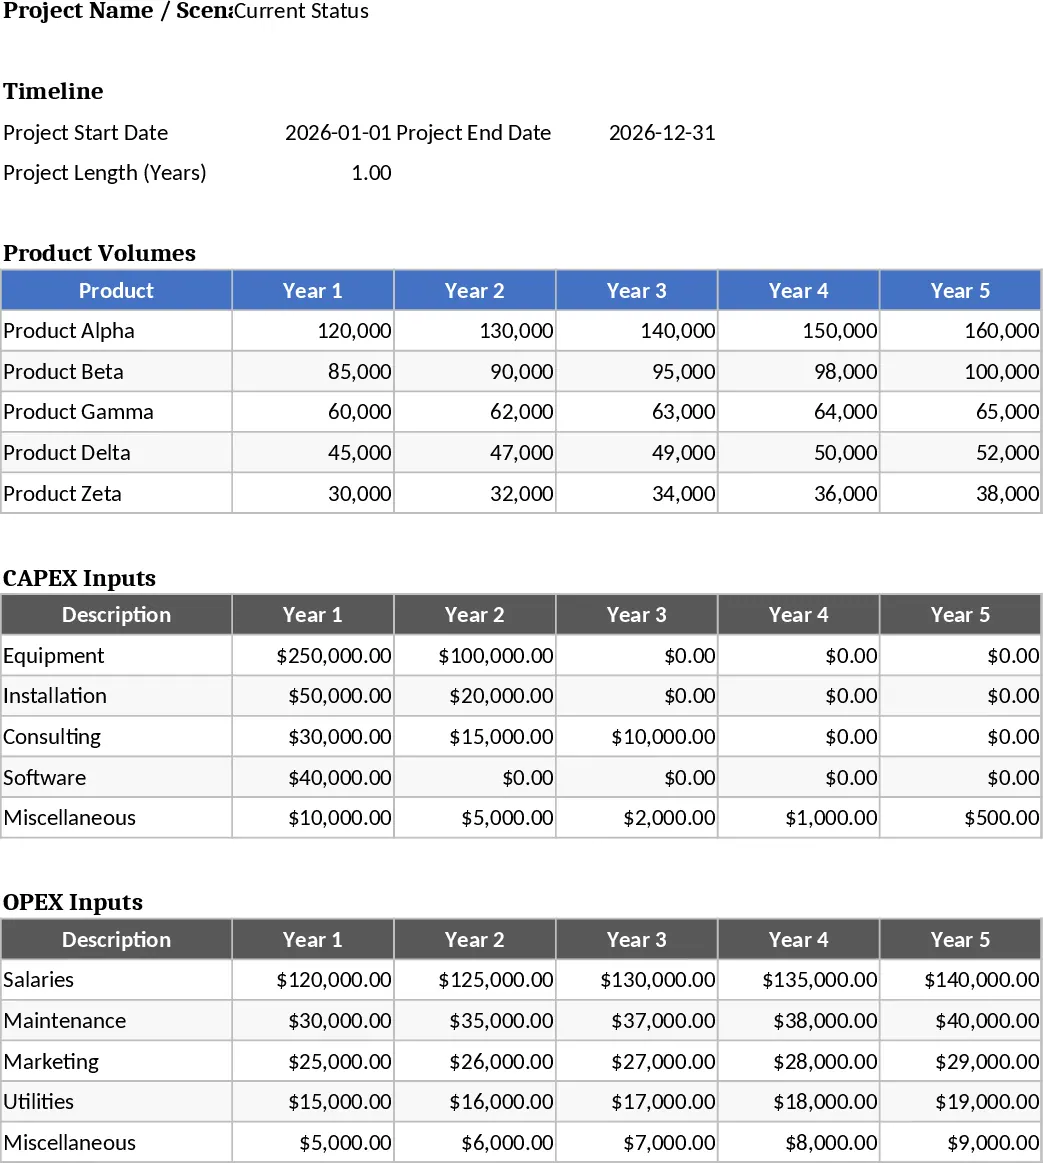
This Financial Scenario Model for Project Evaluation is a comprehensive decision-support tool designed to help organizations navigate the complexities of capital allocation and strategic planning. At its core, the template provides a structured environment to compare multiple project proposals against a Current Status or Do Nothing baseline. This is essential for businesses that need to justify new investments by demonstrating clear financial improvements over existing operations. The template is organized into intuitive modules, including a global assumptions sheet, detailed CAPEX and OPEX input sections, and dynamic volume projection tables that account for varying project lengths and ramp-up periods.
The utility of this model lies in its ability to handle multi-year timelines and fluctuating product volumes. Whether you are considering a factory expansion, a new software implementation, or a product line launch, the template allows you to input specific cost drivers and revenue generators. You can define when capital is spent, how operational costs scale with volume, and how long the project lifecycle is expected to last. By centralizing these variables, the model automatically calculates key performance indicators such as Net Present Value (NPV), Internal Rate of Return (IRR), and Payback Period, providing a standardized metric for comparing diverse projects.
This tool is particularly beneficial for finance directors, project management offices, and business development managers. In a typical scenario, a team might be choosing between different equipment upgrades. By using this template, they can model a high-CAPEX/low-OPEX option against a low-CAPEX/high-OPEX alternative, seeing exactly when the more expensive investment starts to pay for itself through operational efficiencies. It solves the common problem of siloed data by bringing all financial assumptions into a single, transparent view that can be easily shared with executive stakeholders for approval.
The template also features a robust Comparison Dashboard. This section uses automated charts and summary tables to highlight the delta between the proposed scenarios and the current state. It tracks cumulative cash flow, annual profitability, and break-even points, making it easy to identify which project offers the best risk-to-reward ratio. The inclusion of sensitivity analysis elements allows users to test how sensitive the project success is to changes in volume or cost, adding an extra layer of security to the decision-making process.
How to use:
- Begin by entering your baseline operational data in the Current Status section, including existing fixed costs and current production volumes to establish a benchmark.
- Move to the Scenario Input sheets to define the specific CAPEX (one-time investments) and OPEX (ongoing expenses) for each new project, ensuring you align them with the appropriate timeline months or years.
- Input your projected product volumes and pricing for each scenario to see how they deviate from the baseline over the project duration.
- Review the Summary Dashboard to compare the financial health of each option, using the automated NPV and ROI metrics to select the most viable path forward.
Expected benefits: This template reduces the hours required to build custom financial models and minimizes the risk of formula errors, leading to faster and more confident investment approvals.
Similar Templates Recommendation
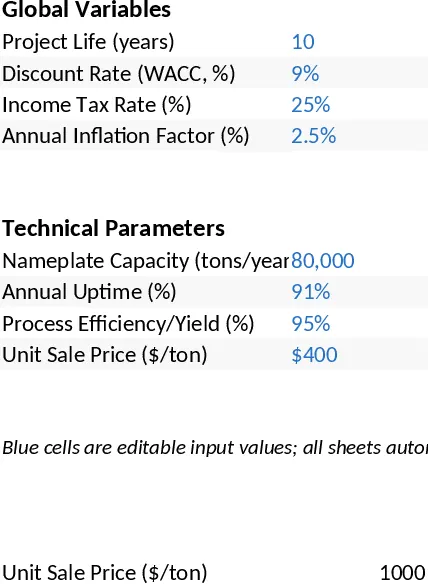
10-Year Techno-Economic Analysis (TEA) Financial Model Template
Conduct a 10-year techno-economic analysis to evaluate project viability using integrated CAPEX, OPEX, and automated NPV/IRR calculations.
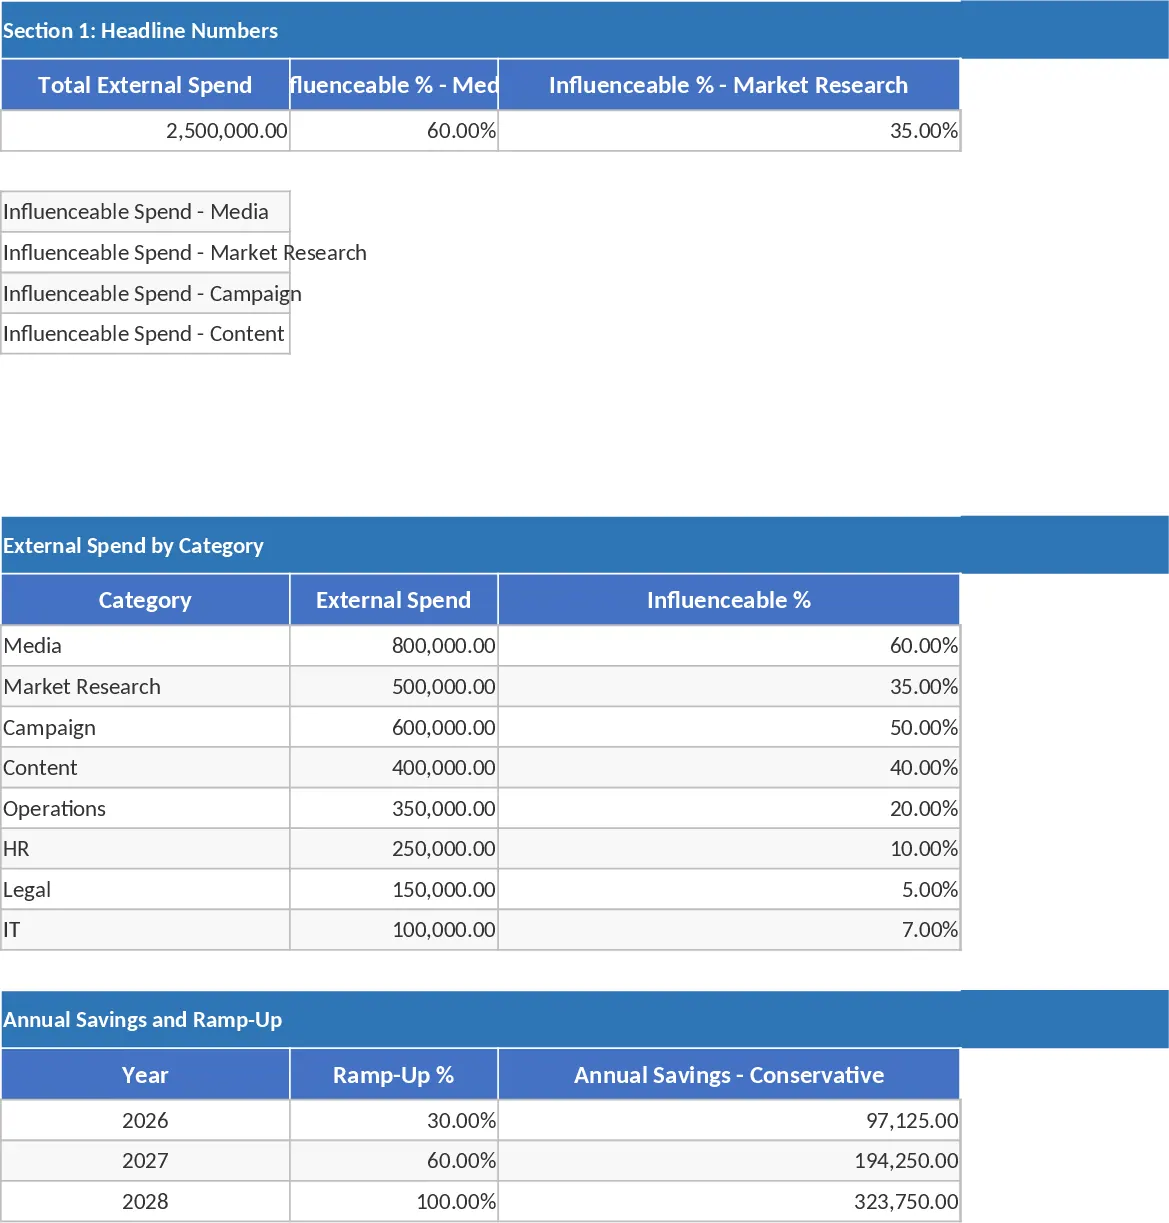
Marketing Cost Reduction and Revenue Uplift Business Case Template
Evaluate marketing cost reductions and revenue uplift using this business case template featuring NPV, ROI, and multi-scenario financial modeling.
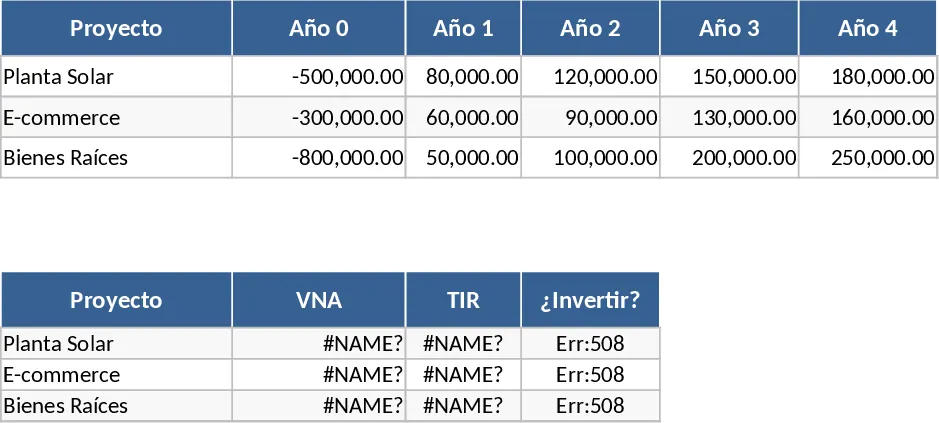
Multi-Project NPV and IRR Investment Analysis Template
Compare multiple investment projects using NPV and IRR metrics to determine financial viability and optimize your capital allocation strategy.