Multi-Project NPV and IRR Investment Analysis Template
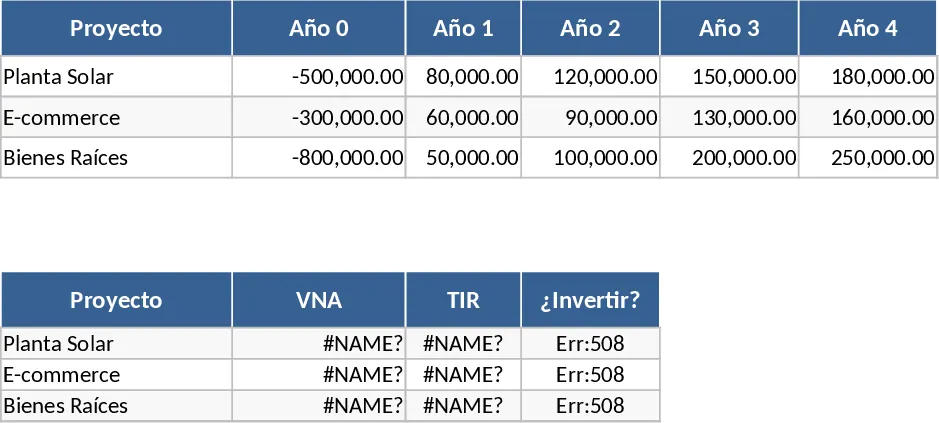
This Financial Evaluation and Investment Decision template is a robust tool designed to help you navigate complex capital budgeting scenarios with confidence. Whether you are weighing the pros and cons of a new solar plant, an e-commerce expansion, or a real estate venture, this template provides a structured framework to compare projects of varying sizes and durations on a level playing field. The core of the template consists of a dedicated evaluation sheet where you can input initial investment costs followed by projected annual cash flows. It features built-in formulas for Net Present Value (NPV) and Internal Rate of Return (IRR), alongside a customizable Weighted Average Cost of Capital (WACC) input to ensure your analysis reflects your specific cost of funding and market conditions.
In a professional environment, choosing the right project is rarely about looking at raw profit; it is about understanding the time value of money and the opportunity cost of capital. This template solves the common struggle of manual financial modeling by automating the heavy lifting of discounted cash flow analysis. By centralizing your data, you can instantly see which projects add real value to the company and which fall short of your required rate of return. It is particularly useful for financial controllers, entrepreneurs, and investment committees who need to present clear, data-backed justifications for their strategic choices. The summary table acts as a decision dashboard, highlighting which projects meet the acceptance criteria—specifically where the NPV is positive and the IRR exceeds the discount rate.
The structure is designed to be intuitive, featuring clear columns for different project scenarios and rows for annual timelines. You can easily adjust the discount rate to perform sensitivity analysis, seeing how a change in interest rates might flip a project from a 'Go' to a 'No-go.' This level of detail helps in identifying the most resilient investments in your portfolio. By standardizing the way you evaluate opportunities, you ensure that every proposal is judged by the same rigorous financial standards, reducing bias and improving the overall quality of your business investments.
How to use this template:
- Enter your estimated initial investment as a negative value in the Year 0 column for each project you wish to evaluate.
- Fill in the projected cash inflows for the subsequent years (Year 1 through Year 5 or more) based on your market research and financial forecasts.
- Input your target discount rate or WACC in the designated parameter cell; this serves as the benchmark for your investment's success.
- Review the comparison table to see the calculated NPV and IRR for each project, allowing you to rank them by profitability and risk.
By using this template, you can transform raw financial data into actionable insights. It eliminates the need to build complex formulas from scratch, significantly reducing the risk of manual errors in your spreadsheets. You can expect to save hours of formatting and calculation time, allowing you to focus on the strategic implications of your investments rather than the mechanics of the math. This structured approach ensures that every investment decision is consistent, transparent, and perfectly aligned with your organization's long-term financial goals.
Similar Templates Recommendation
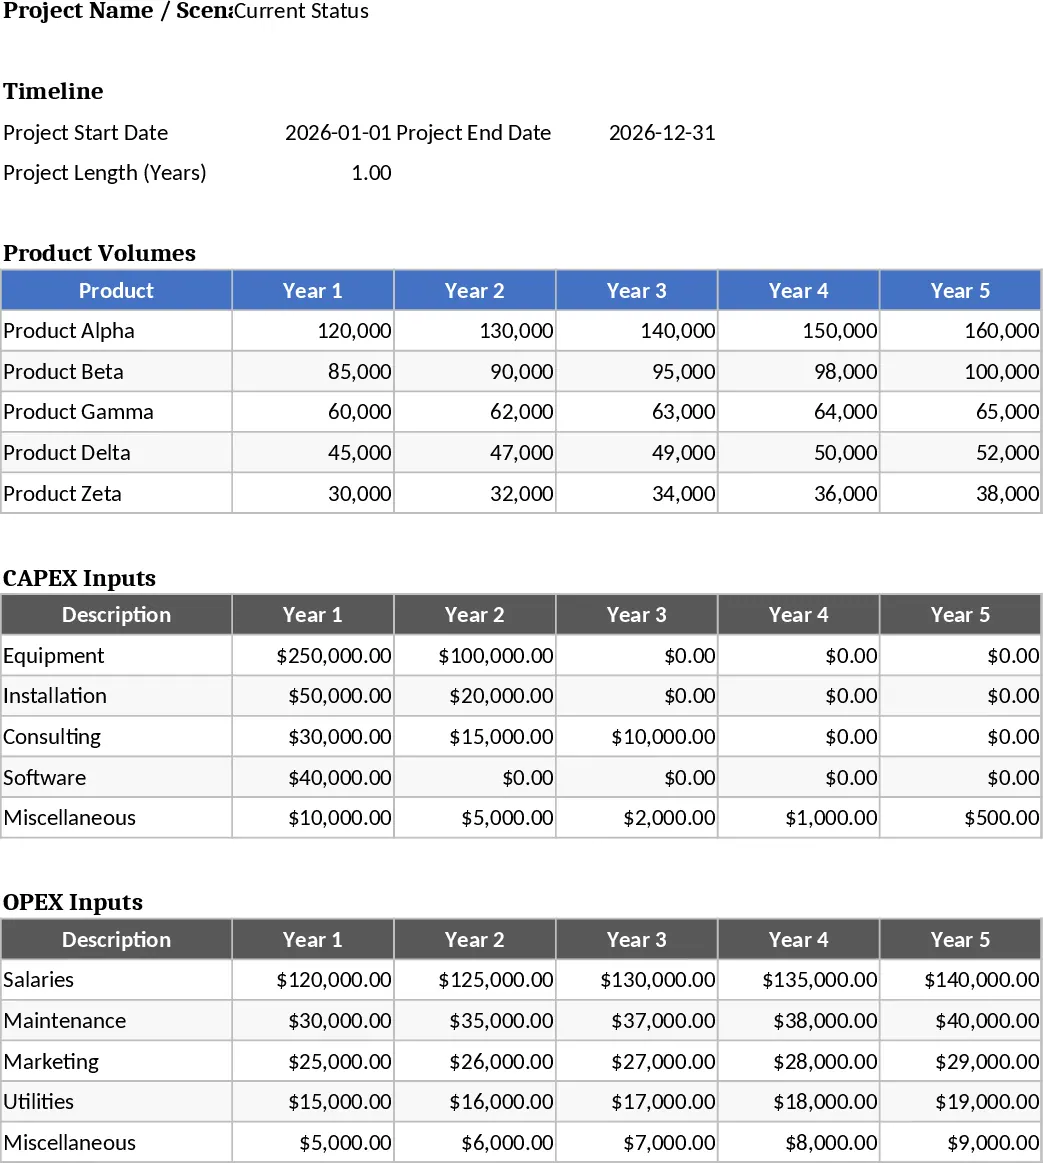
Project Financial Scenario Modeling and Evaluation Template
Compare project scenarios by analyzing CAPEX, OPEX, and volume timelines against current status to drive informed investment decisions.
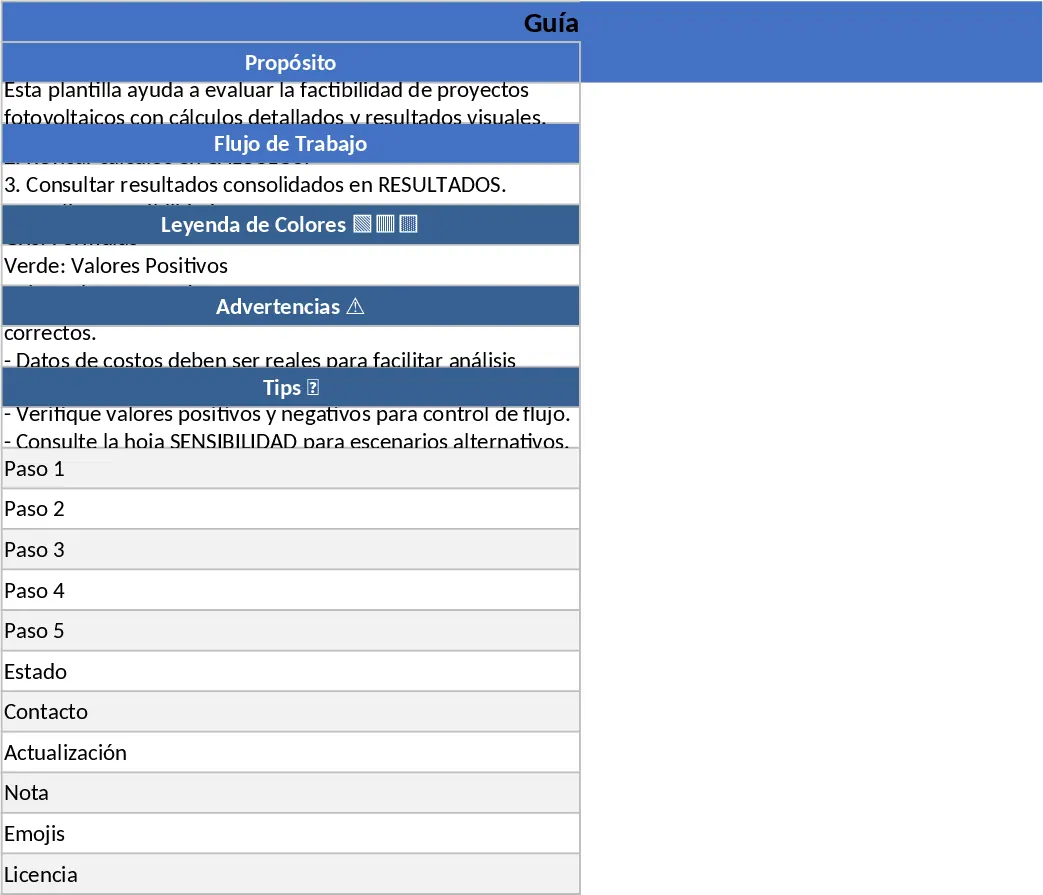
Solar PV Feasibility Study Template
Evaluate the financial and technical viability of solar energy projects with 25-year projections, NPV, IRR, and LCOE metrics.
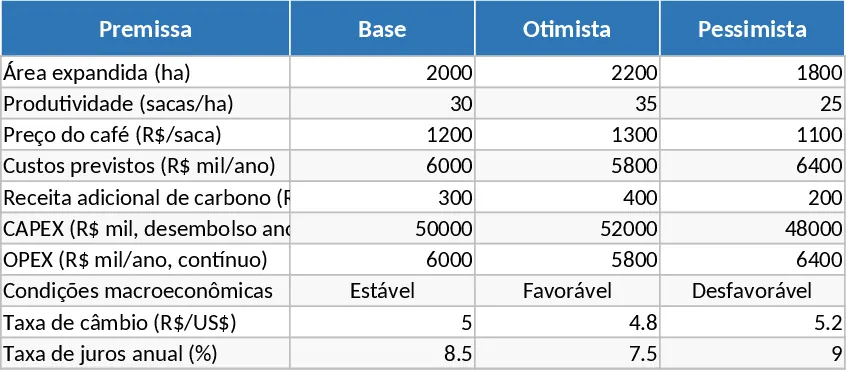
Agricultural Expansion Financial Model and Investor Return Analysis Template
Evaluate agricultural expansion projects with this comprehensive financial model featuring CAPEX, OPEX, IRR, and sensitivity analysis for investors.