Agricultural Expansion Financial Model and Investor Return Analysis Template
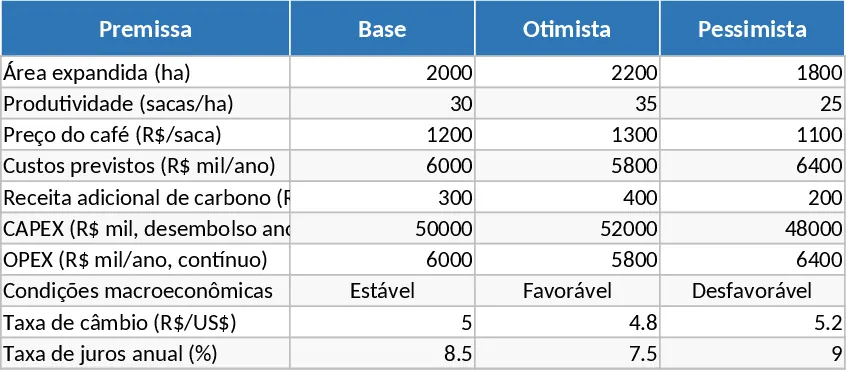
Navigating large-scale agricultural investments requires more than just intuition; it demands a rigorous financial framework that can withstand investor scrutiny. This professional-grade Excel template is specifically designed for agricultural expansion projects, such as the development of thousands of hectares of new land. It provides a transparent, fully open structure that allows you to model every financial aspect of a farming operation over a 10 to 20-year horizon. By separating inputs from calculations, the template ensures that you can adjust variables like land acquisition costs, productivity rates, and market prices without breaking the underlying logic.
The template is organized into logical modules that mirror the workflow of a professional financial analyst. It begins with a centralized Assumptions tab where you define the project scope, including total area, implementation schedules, and macroeconomic factors like inflation and the Weighted Average Cost of Capital (WACC). The CAPEX section allows for a granular breakdown of initial investments, from soil preparation and infrastructure to machinery and initial working capital. On the operational side, the OPEX module tracks recurring costs per hectare, including labor, inputs, and logistics, providing a clear view of the project's ongoing burn rate and efficiency.
For those seeking to secure external funding or equity partners, the template generates high-level financial indicators automatically. You will find dedicated sections for Project and Equity Cash Flows, calculating essential metrics such as Net Present Value (NPV), Internal Rate of Return (IRR), and both simple and discounted Payback periods. The inclusion of a Sensitivity Analysis table is particularly valuable for risk management, as it allows you to see how fluctuations in commodity prices or productivity levels impact your bottom line. This level of detail transforms a simple spreadsheet into a powerful decision-making tool that builds confidence with stakeholders and financial institutions.
How to use this template:
- Start in the Assumptions tab to input your core project data, including the total hectares, expected yield per hectare, and your financing structure (debt vs. equity).
- Fill out the CAPEX and OPEX schedules by entering your estimated costs for land, equipment, and annual operations to establish your cash outflow profile.
- Review the Revenue and Cash Flow tabs to see the automated projections, then use the Sensitivity Analysis section to test your project against optimistic and pessimistic market scenarios.
By using this structured approach, you can expect to save dozens of hours in manual modeling while producing a professional investment memorandum that clearly demonstrates the project's break-even price and long-term profitability.
Similar Templates Recommendation
10-Year Techno-Economic Analysis (TEA) Financial Model Template
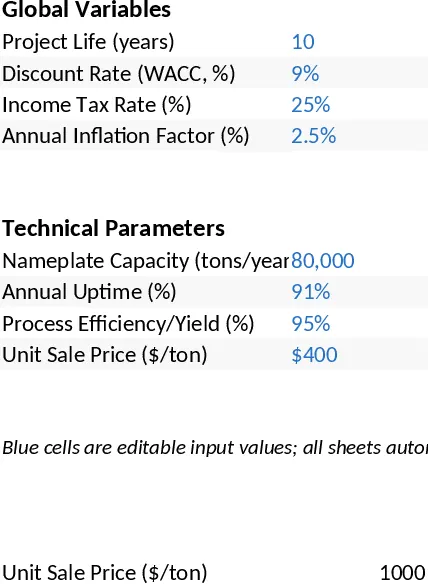
Conduct a 10-year techno-economic analysis to evaluate project viability using integrated CAPEX, OPEX, and automated NPV/IRR calculations.
Multi-Project NPV and IRR Investment Analysis Template
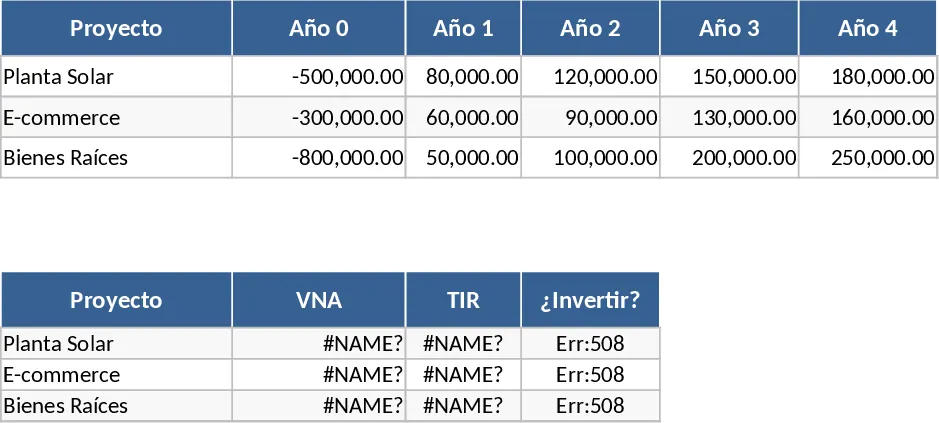
Compare multiple investment projects using NPV and IRR metrics to determine financial viability and optimize your capital allocation strategy.
Solar PV Feasibility Study Template
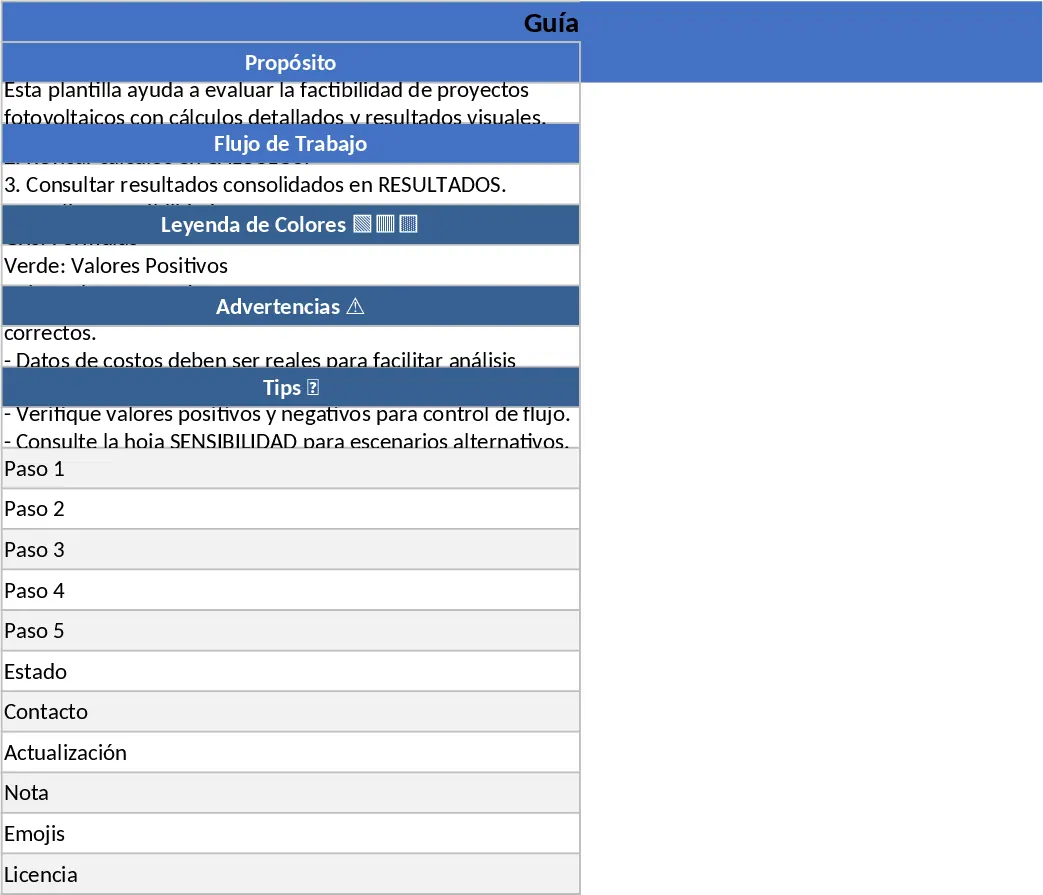
Evaluate the financial and technical viability of solar energy projects with 25-year projections, NPV, IRR, and LCOE metrics.