

Social Media & Website Communication KPI Dashboard Template
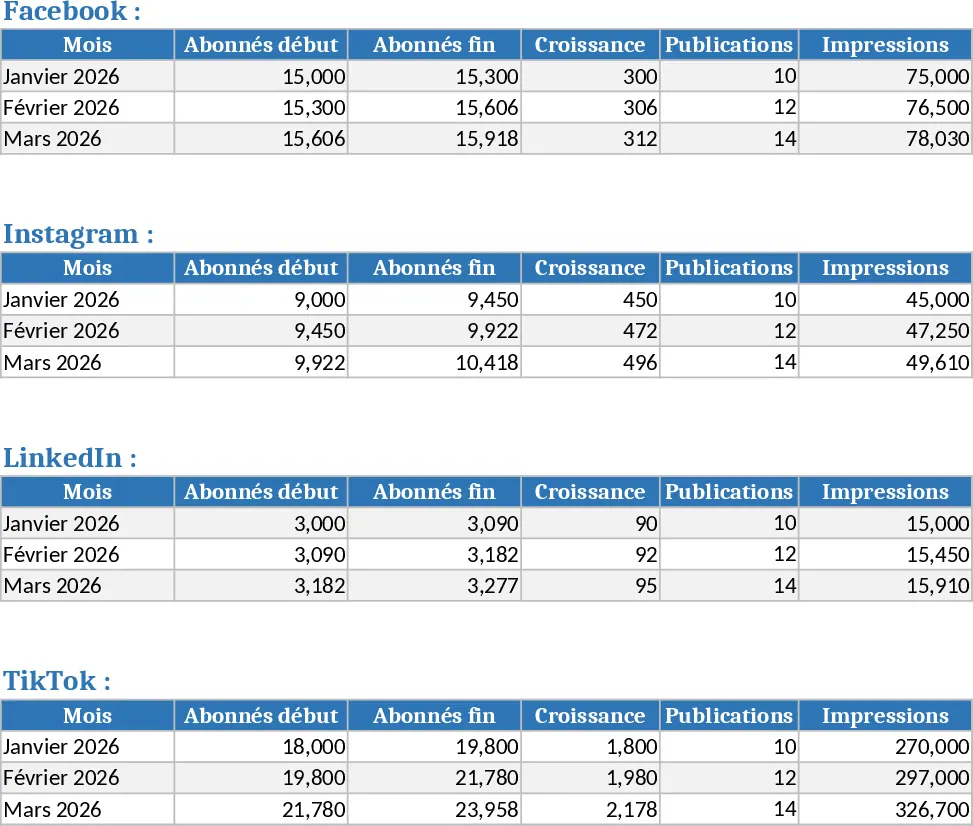
This template is built to feed a Tableau dashboard that gives you a clear, at‑a‑glance view of your communication performance across the major social platforms and your corporate website. The workbook is split into three main sheets: Data Input, KPI Calculations, and Dashboard Preview. In the Data Input sheet you’ll find a table for each channel – Facebook, Instagram, LinkedIn, TikTok, and Web – with columns for Date, Posts, Reach, Impressions, Likes, Comments, Shares, Click‑throughs, Followers, and any custom metric you need. Drop‑down lists let you select the platform, making data entry fast and error‑free. The KPI Calculations sheet pulls those raw numbers and automatically computes key indicators such as Total Reach, Engagement Rate, Click‑through Rate, Follower Growth, and Conversion Rate. These metrics are summarized in pivot‑style tables and ready‑to‑use charts that Tableau can read directly. Finally, the Dashboard Preview sheet shows a mock‑up of the Tableau visual – scorecards, trend lines, and channel comparison graphs – so you can see exactly what the final dashboard will look like once you publish the workbook.
The template solves the common headache of juggling multiple spreadsheets, manual formulas, and inconsistent reporting formats. By centralising all channel data in one place and automating the KPI calculations, you eliminate duplicate work and reduce the risk of errors. The visual output in Tableau lets you spot trends, compare platform performance, and make data‑driven decisions about content strategy, budget allocation, and audience targeting. Whether you need a weekly status update for senior leadership or a deep‑dive analysis for a campaign post‑mortem, this solution gives you reliable numbers in minutes instead of hours.
It is ideal for communication managers, social media specialists, digital marketers, and anyone responsible for measuring the impact of online content. If you run regular reports for multiple platforms, need to align website traffic with social engagement, or simply want a single source of truth for your digital presence, this template fits perfectly. The built‑in calculations also help you track progress against targets, making it easy to demonstrate ROI to stakeholders.
How to use
- Open the Excel file and go to the Data Input sheet. Enter your daily or weekly metrics for each platform, using the drop‑down to select the correct channel.
- Save the file and refresh the KPI Calculations sheet – the formulas update automatically, showing the latest totals and rates.
- Open Tableau and connect to the Excel workbook; the pre‑configured data source will pull the KPI tables and generate the dashboard visual.
- Review the Dashboard Preview sheet or the live Tableau view to see scorecards, trend charts, and comparative graphs. Export or share the dashboard as needed.
Expected benefits: streamlined data entry, instant KPI updates, and a professional dashboard that cuts reporting time dramatically while improving insight quality.
Similar Templates Recommendation
Secondary School Results and Ranking Template
Track up to 200 secondary students' marks, auto‑calculate grades, averages, divisions and rankings in a clear, formatted sheet.

Couple Budget and Cash Flow Tracker Template
Track monthly income, expenses, and cash flow for a working couple, visualize budgets and savings goals in one spreadsheet.

Date Range and Internal Log Template
Create an Excel file with two columns for dates and internal notes, with colored rows for different date ranges.
