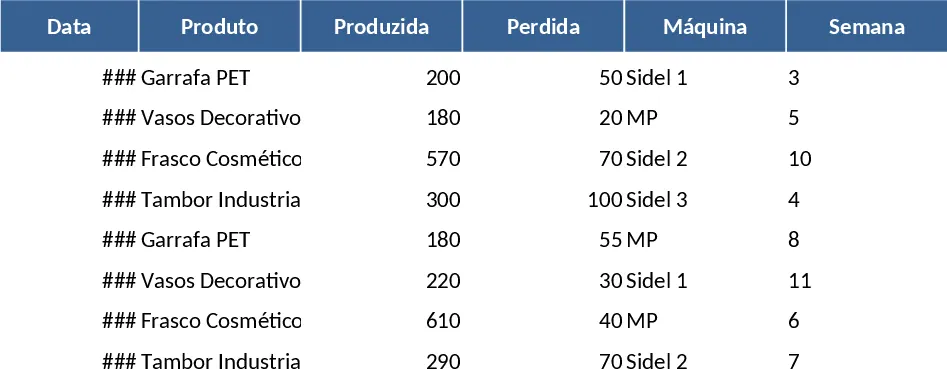
Weekly and Annual Production Tracking Template
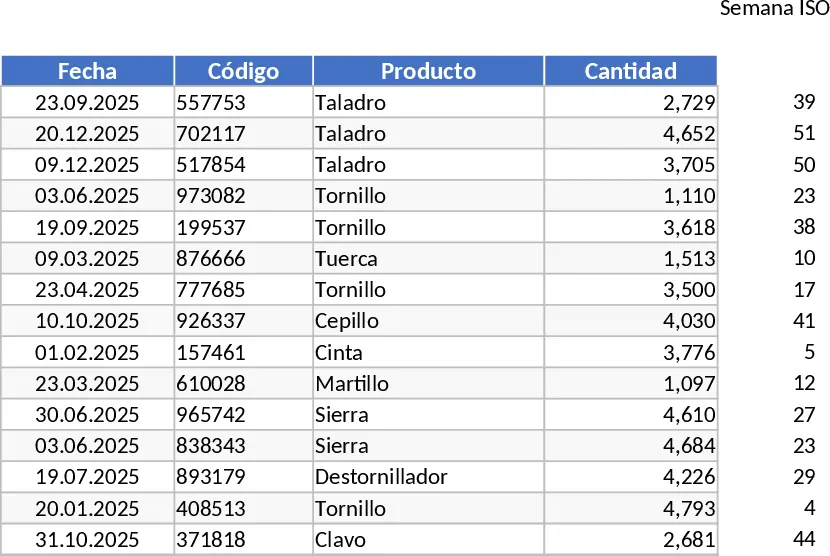
This Production Summary Workbook is a robust tool designed to streamline how you track and analyze output across your operations. By centralizing your data entry into a single, structured database, you eliminate the need for repetitive manual calculations and fragmented spreadsheets. The workbook is organized into three core components: a primary Database for raw data entry, a Weekly Summary for immediate operational insights, and an Annual Summary for high-level strategic planning.
In the Database sheet, you can record every production event, including item codes, dates, and specific quantities produced. This serves as the single source of truth for your entire operation. The Weekly Summary sheet is pre-configured to pull this data and organize it by item code, giving you a clear picture of what was accomplished during the current week. For long-term oversight, the Annual Summary provides a monthly breakdown, allowing you to spot seasonal trends, growth patterns, or potential declines in specific product lines. This structure ensures that whether you are looking at the granular details of a Tuesday afternoon or the broad performance of the third quarter, the information is always at your fingertips.
This tool is particularly beneficial for production managers, inventory controllers, and small manufacturing teams who need to maintain tight control over their output without investing in complex ERP software. It helps you stay organized, ensures data consistency, and provides the metrics needed to make informed decisions about resource allocation and scheduling. By using this template, you can quickly identify which items are meeting targets and which might require more attention, all while maintaining a clean and professional record of your work.
How to use:
- Start by entering your production logs in the Database sheet, ensuring each entry has a date, a unique item code, and the quantity produced.
- Visit the Weekly Summary sheet to see your production totals automatically aggregated by code for the current week; the formulas will handle the grouping for you.
- Review the Annual Summary sheet to monitor your monthly performance throughout the year, helping you compare output across different months and identify seasonal peaks.
Expected benefits: This template significantly reduces the time spent on manual data consolidation and minimizes human error in reporting, allowing you to focus more on optimizing your production workflow and less on spreadsheet maintenance.
Similar Templates Recommendation
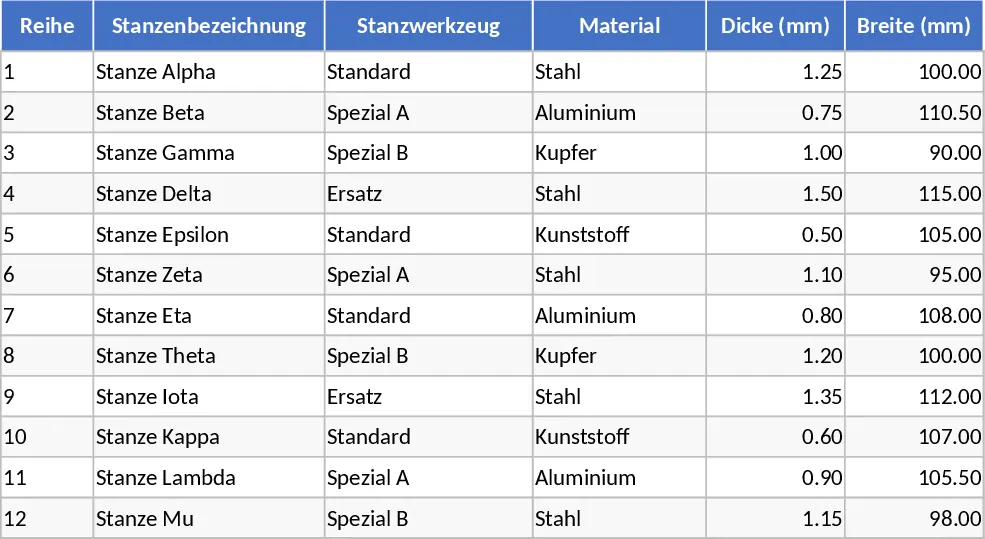
Punch Tool Management and Stroke Rate Calculation Template
Organize and track punching tools across multiple rows with machine settings, stroke rates, and automated production calculations.
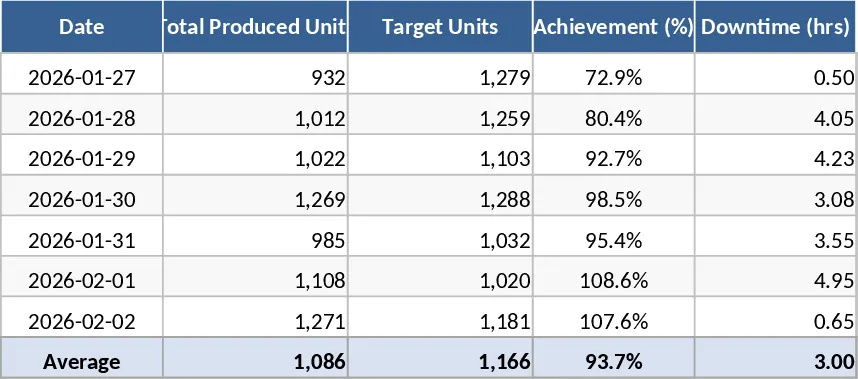
PPGI Sheet Production Planning Template
Manage PPGI sheet manufacturing schedules, track material usage, and monitor daily production targets to optimize factory output and efficiency.
Blow Molding Production Control and Inventory Management Template
Manage blow molding production across five machines with automated stock tracking, weekly performance summaries, and low-inventory alerts.