

Strategic Media Mix & Flowchart Planning Template
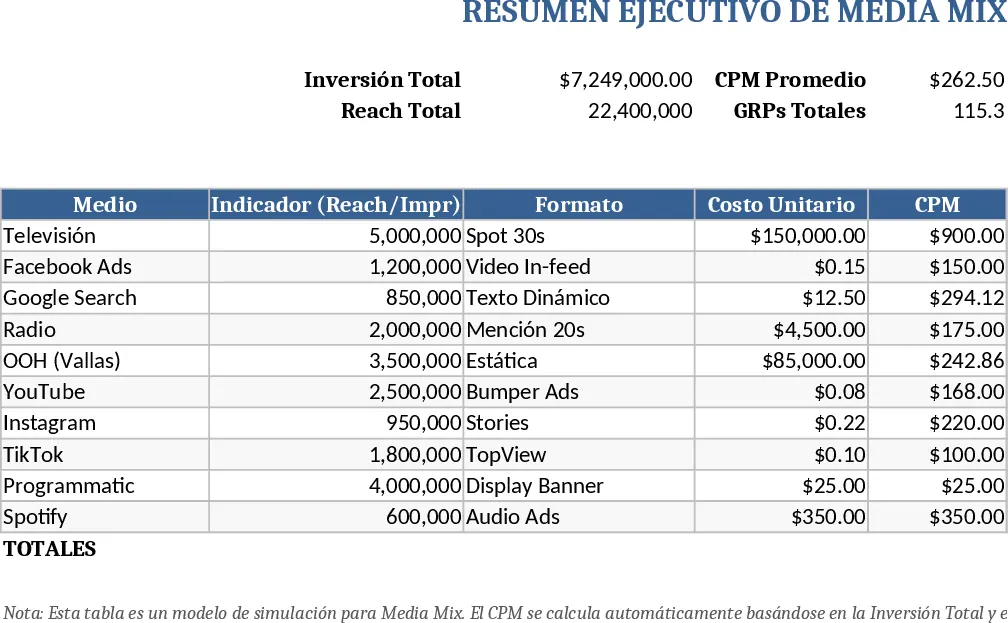
This Excel template is split into two clear sheets – Media Mix and Flowchart – and is crafted to teach MBA‑level strategic media planning for a snack brand targeting 18‑30‑year‑olds in Guatemala.
In the Media Mix sheet you’ll find columns for Media Channel (TV, Digital, OOH, Radio, etc.), Strategic Role (Awareness, Frequency, Performance), Allocation % and Calculated Budget. Drop‑down lists guide you to pick the right channel and role, while formulas automatically compute the monetary amount from the total budget (Q300,000). A summary table at the top shows the total spend, the weighted share of each channel, and a quick SOV indicator.
The Flowchart sheet pulls the channel budgets from Sheet 1 and spreads them across the 12 months. Instead of a flat line, the sheet includes conditional‑format heat‑map cells that highlight peaks and troughs, encouraging you to align spend with key consumer moments (e.g., back‑to‑school in March, mid‑year festivals, November snack spikes). A small chart visualizes the rhythm, making it easy to spot whether the plan is too flat or overly concentrated.
This template solves the common problem of turning high‑level media objectives into a concrete, data‑driven plan. It forces you to justify every allocation, think about the strategic purpose of each medium, and match spend to consumer behavior patterns. The result is a disciplined, visual plan that can be presented to stakeholders, showing both the financial breakdown and the timing logic behind it.
Who benefits?
- MBA students learning strategic media planning.
- Marketing teams preparing a classroom or workshop exercise.
- Instructors who need a ready‑made, interactive workbook for teaching.
What it helps you track and produce?
- Percentage and monetary allocation per media channel.
- Strategic role of each channel (awareness, frequency, performance).
- Monthly spend distribution with visual heat‑maps.
- Alignment of spend peaks with key consumer buying periods.
How to use
- Open the Media Mix sheet, select each media channel from the drop‑down, assign a strategic role, and input the desired allocation %. The sheet will auto‑calculate the budget per channel.
- Move to the Flowchart sheet, where the channel budgets are already linked. Adjust the monthly percentages to create peaks that match consumer behavior (e.g., higher spend in March and November). The heat‑map will update instantly.
- Review the summary chart and heat‑map to ensure the plan shows clear peaks and a logical rhythm. Make any needed tweaks.
- Validate that the total of the monthly allocations equals the original Q300,000 budget and that the strategic rationale holds for each peak.
Expected benefits: By following this guided workbook, you’ll spend less time wrestling with raw numbers and more time sharpening strategic insight, producing a clear, defensible media plan in a single session.
Similar Templates Recommendation
Secondary School Results and Ranking Template
Track up to 200 secondary students' marks, auto‑calculate grades, averages, divisions and rankings in a clear, formatted sheet.

Couple Budget and Cash Flow Tracker Template
Track monthly income, expenses, and cash flow for a working couple, visualize budgets and savings goals in one spreadsheet.

Date Range and Internal Log Template
Create an Excel file with two columns for dates and internal notes, with colored rows for different date ranges.
