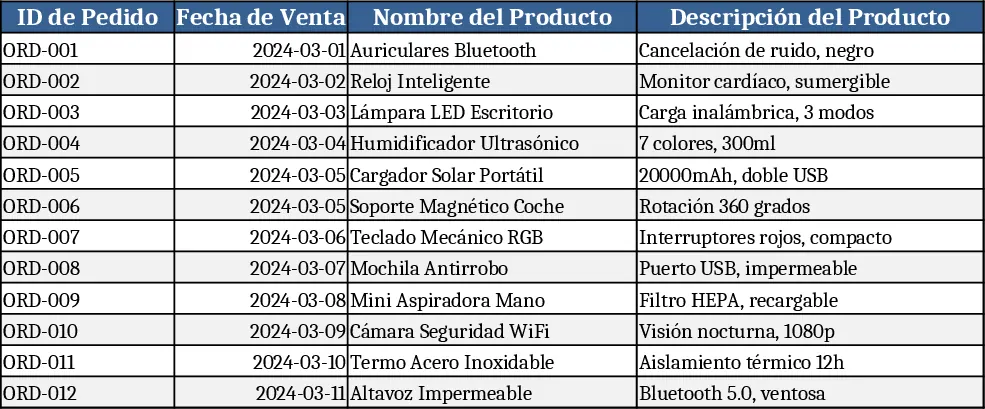
Inventory, Movement & Profit Analyzer Template
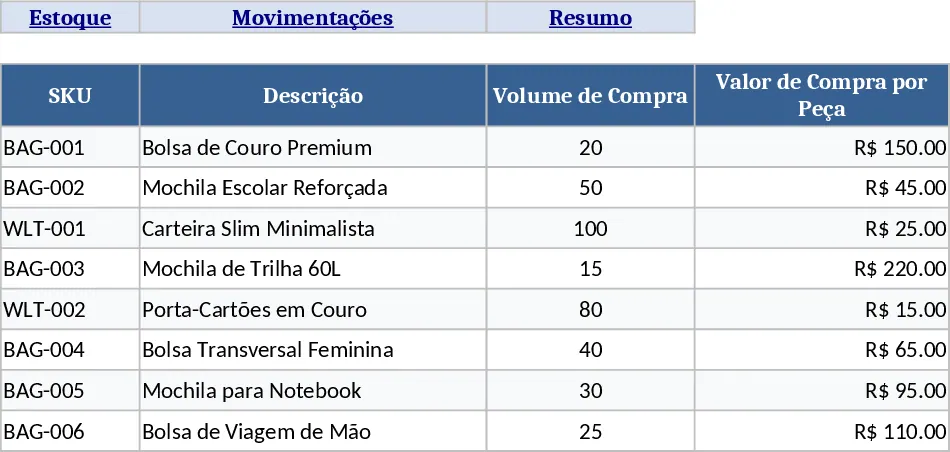
This advanced Google Sheet template is organized into three dedicated tabs that together give you full control over inventory and sales performance. The Inventory tab lists each product by SKU, description, purchase volume, unit cost, extra expenses (freight, packaging, etc.), desired profit margin, calculated ideal selling price, and estimated profit per unit. The Movements tab records every inbound and outbound transaction, capturing SKU, description, quantity, purchase value, selling value, and the profit realized on each movement. The third tab, Summary, filters the movement data to automatically compute total revenue, total profit, and key performance indicators such as average margin and turnover rate. Interactive buttons placed on each sheet let you jump between tabs, add new rows, or refresh calculations with a single click, making navigation smooth and error‑free.
Designed for small‑to‑medium business owners, inventory managers, and sales teams, this template solves the common headache of juggling separate spreadsheets for stock and sales. By consolidating purchase costs, extra fees, and sales data in one place, you eliminate manual cross‑referencing, reduce data entry errors, and gain instant insight into how pricing decisions affect profitability. The built‑in profit calculations help you set realistic selling prices and monitor whether you’re meeting your margin targets, while the summary view turns raw transaction logs into clear, actionable financial snapshots.
How to use
- Open the Inventory tab and fill in each product’s SKU, description, purchase quantity, unit cost, and any additional expenses; the sheet will auto‑compute the ideal selling price based on the margin you set.
- Record every stock receipt or sale in the Movements tab, selecting the appropriate SKU and entering quantities, purchase and selling values; profit for each line is calculated automatically.
- Switch to the Summary tab or click its button to see aggregated revenue, total profit, and other key metrics filtered by date range or product category.
- Use the navigation buttons to add new items, clear filters, or jump back to the main tabs as needed.
Expected benefits: faster inventory reconciliation, clearer profit visibility, and fewer manual calculations, freeing up time for strategic decisions.
Similar Templates Recommendation
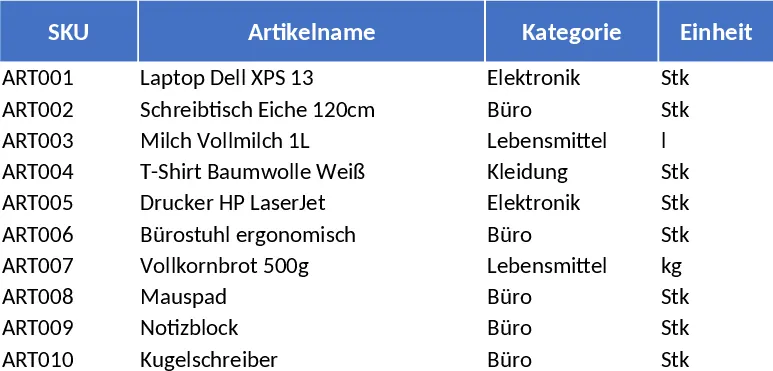
Inventory Management Tracker with Item Master & Movements Template
A ready‑to‑use Excel template that tracks items, records stock movements, and automatically calculates current inventory with reorder alerts.
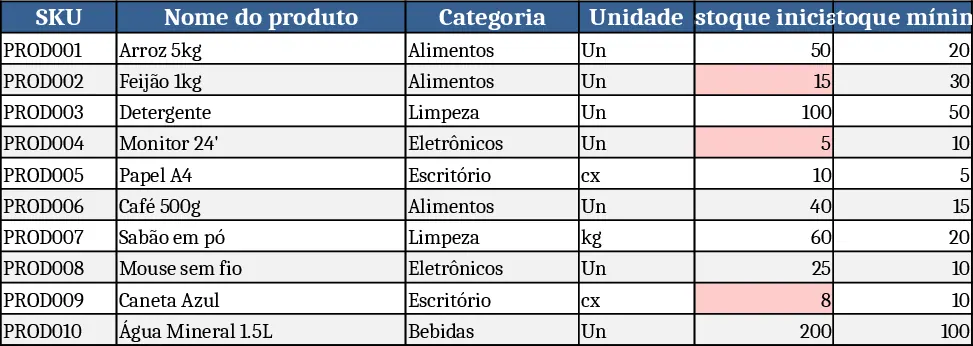
Inventory Management Tracker with Category Breakdown Template
Track product stock levels, movements, and reorder alerts in a three‑sheet Excel template with master data, transaction log, and summary.
Dropshipping Business Management Dashboard Template
Track dropshipping orders, sales, margins and order status in Excel, with ready‑made pivot reports for monthly sales and product profitability.