

Modern Plant Daily Chemical Analysis Report Template
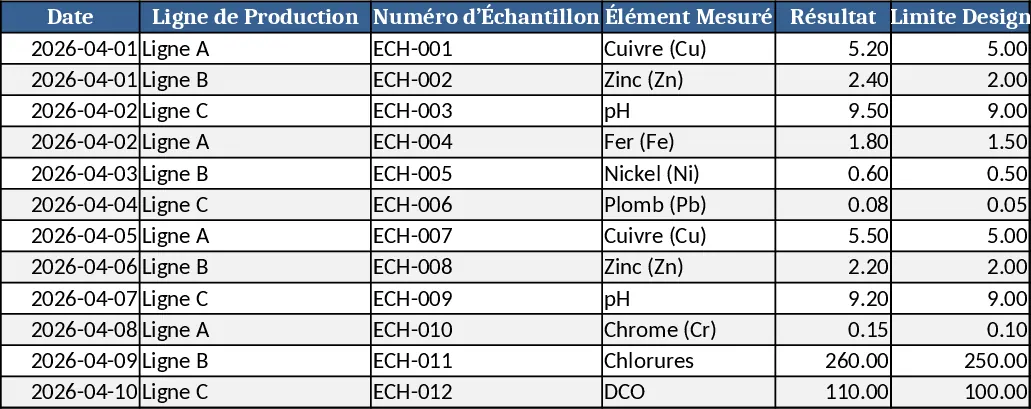
This template is built for plant laboratories that need to record and communicate daily chemical test results. It consists of three main sheets: Data Entry, Calculations, and Summary. In the Data Entry sheet you list each sample, the test date, the analyst, and the measured parameters (pH, conductivity, metal concentrations, etc.). Drop‑down lists standardize units and test methods, while conditional formatting flags values that fall outside predefined limits. The Calculations sheet automatically converts units, aggregates results by shift or production line, and calculates key statistics such as average, min, max, and compliance rate. The Summary sheet presents a clean, printable report with charts that show trends over the past week, month, or custom period, plus a compliance dashboard that highlights any out‑of‑spec results.
The template solves the common headache of scattered lab notebooks and manual spreadsheets. By centralising data entry and automating calculations, it reduces transcription errors, speeds up report generation, and provides instant visibility into product quality. Managers can quickly see whether the plant is meeting regulatory limits, while lab technicians spend less time formatting and more time analysing. It is especially useful for continuous‑process industries—chemicals, food & beverage, pharmaceuticals—where daily monitoring is mandatory for safety and certification.
Anyone who works in a plant quality‑control lab, a production supervisor, or a compliance officer will find this template valuable. It fits scenarios where daily sampling is routine, results must be shared with production teams, and trends need to be tracked for process optimisation. The template helps you track each sample’s parameters, monitor compliance percentages, and produce a ready‑to‑print report that can be attached to shift hand‑overs or regulatory submissions.
How to use
- Open the Data Entry sheet and fill in the sample ID, date, shift, analyst name, and measured values. Use the provided drop‑downs for units and test methods to keep data consistent.
- Switch to the Calculations sheet; the formulas run automatically, updating averages, limits checks, and compliance metrics.
- Go to the Summary sheet, select the desired date range from the top‑right filter, and watch the charts and compliance dashboard refresh.
- Click the Print Report button (or copy the Summary range) to generate a polished daily report for distribution.
Expected benefits include faster report turnaround, fewer manual errors, and clearer insight into daily chemical quality, freeing up staff to focus on corrective actions rather than data wrangling.
Similar Templates Recommendation
Secondary School Results and Ranking Template
Track up to 200 secondary students' marks, auto‑calculate grades, averages, divisions and rankings in a clear, formatted sheet.

Couple Budget and Cash Flow Tracker Template
Track monthly income, expenses, and cash flow for a working couple, visualize budgets and savings goals in one spreadsheet.

Date Range and Internal Log Template
Create an Excel file with two columns for dates and internal notes, with colored rows for different date ranges.
