

Comprehensive Product Pricing and Cost Analysis Template
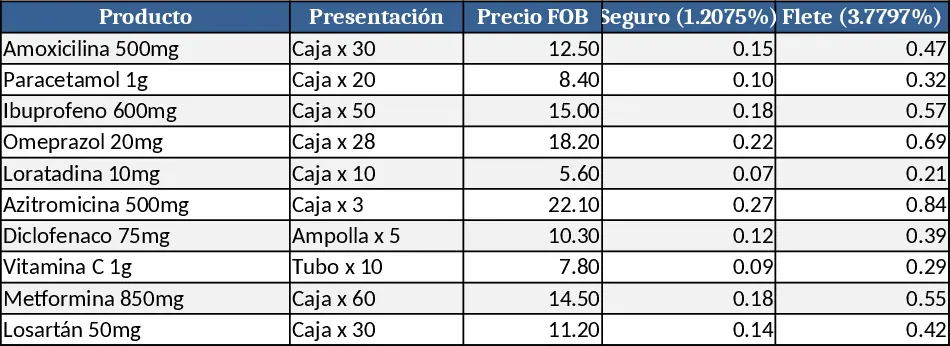
This Excel template is organized into three main sheets – Input, Calculations, and Summary. In the Input sheet you list each product, its presentation, FOB price and the percentages for insurance (1.2075%), freight (3.7797%), international tax (3%), and the target margin (30%). The sheet also contains fields for reported CIF, maximum bonus (up to 20%), net profit, pharmacy price, public price and the commercialization cost (capped at 4% of sales). A separate Labor Cost section captures the 9 commercial sellers (base C$11,500, 1.5% commission split into 1% tax and 0.5% vehicle depreciation), 4 tele‑sales agents (base C$10,800, 0.75% commission), two order‑pickers (C$12,000 each, 20 orders/day), and one delivery person for Managua (same salary, plus C$1,200 motorcycle depreciation and C$3,000 fuel). All statutory contributions – 13th‑month, INSS, IR, INATEC and employer’s social charge – are built‑in.
The Calculations sheet turns those raw inputs into a complete cost structure. Formulas automatically convert FOB to CIF, add insurance, freight and international tax, apply the chosen margin, and compute the final public price. Labor expenses are prorated over an average of 22 productive days, commissions are deducted, taxes are applied, and depreciation is spread across the month. The sheet also generates the total cost per unit, the contribution margin, and a profitability flag that turns green when the net profit exceeds a user‑defined threshold.
The Summary sheet aggregates the results for quick decision‑making. It shows a pivot‑style table with each product’s total cost, gross margin, net profit, and the overall impact of sales‑force expenses. A small dashboard visualizes the top‑5 most profitable items, the average commission burden, and the total monthly payroll. This layout lets finance analysts, product managers or pricing teams instantly see whether a product is financially viable, where cost‑saving opportunities exist, and how different bonus structures affect the bottom line.
How to use
- Fill the Input sheet with product data and the basic salary/commission parameters for each employee group.
- Verify that the percentage rates (insurance, freight, tax, margin, commercialization cost) match your current agreements.
- Switch to the Calculations sheet – all formulas run automatically, populating cost, price and profit columns.
- Review the Summary sheet to identify profitable products, adjust margins or bonuses, and export the table for reporting.
Expected benefits: the template eliminates manual spreadsheet gymnastics, cuts the time needed to produce a full cost‑price analysis from hours to minutes, and improves pricing accuracy while keeping all tax and labor considerations transparent.
Similar Templates Recommendation
Secondary School Results and Ranking Template
Track up to 200 secondary students' marks, auto‑calculate grades, averages, divisions and rankings in a clear, formatted sheet.

Couple Budget and Cash Flow Tracker Template
Track monthly income, expenses, and cash flow for a working couple, visualize budgets and savings goals in one spreadsheet.

Date Range and Internal Log Template
Create an Excel file with two columns for dates and internal notes, with colored rows for different date ranges.
