

Marketing Tracking Dashboard Template
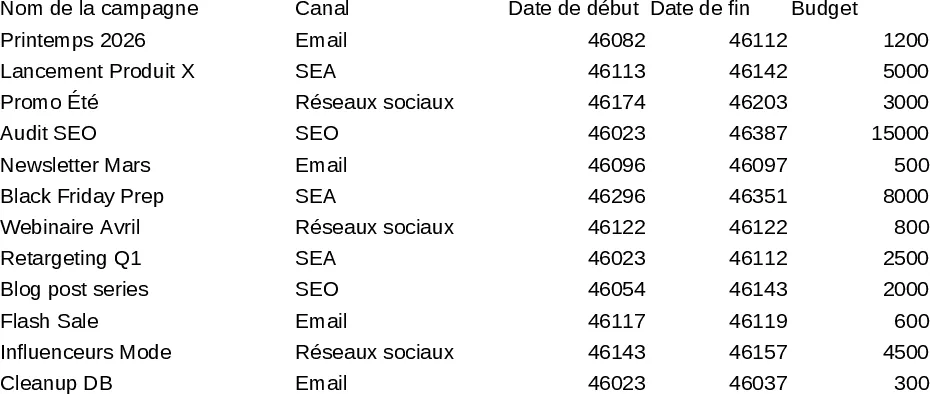
This template provides a complete marketing tracking dashboard built on a single workbook with three main sheets: Data Input, Metrics, and Dashboard. In the Data Input sheet you list each campaign, its start and end dates, channel (email, social, paid search, etc.), budget, and actual spend. Drop‑down lists standardize channel names and status (Planned, Running, Completed). The Metrics sheet automatically calculates key figures such as Cost‑Per‑Lead, Click‑Through Rate, Conversion Rate, and Return on Investment using simple formulas that reference the raw data. The Dashboard sheet pulls these calculations into charts, slicers and KPI cards, letting you filter by date range, channel or campaign status to see real‑time performance snapshots.
The dashboard solves the common pain of scattered marketing data across spreadsheets, email reports and ad platforms. By consolidating everything into one place, you gain instant visibility into which campaigns are delivering the best ROI, where budgets are being overspent, and how lead quality is trending over time. This helps marketing managers make data‑driven decisions, justify spend to leadership, and quickly reallocate resources without digging through multiple files.
Ideal for marketing coordinators, digital advertising specialists, and small‑to‑medium business owners who need a quick, low‑cost way to monitor campaign health. Whether you run weekly email blasts, monthly social media pushes, or quarterly paid search drives, the template adapts to any channel mix and scales as you add new campaigns.
How to use
- Open the Data Input sheet and fill in each campaign row with the required fields; use the provided drop‑downs for channel and status.
- Review the Metrics sheet – the calculations update automatically; adjust any custom formulas if you have additional KPIs.
- Switch to the Dashboard sheet, apply slicers to filter by date, channel or status, and read the visual summaries.
- Export the dashboard as a PDF or share the workbook with your team for collaborative tracking.
Expected benefits include faster reporting cycles, clearer insight into spend efficiency, and reduced manual effort when compiling performance summaries.
Similar Templates Recommendation
Secondary School Results and Ranking Template
Track up to 200 secondary students' marks, auto‑calculate grades, averages, divisions and rankings in a clear, formatted sheet.

Couple Budget and Cash Flow Tracker Template
Track monthly income, expenses, and cash flow for a working couple, visualize budgets and savings goals in one spreadsheet.

Date Range and Internal Log Template
Create an Excel file with two columns for dates and internal notes, with colored rows for different date ranges.
