

Santa Cruz Homicide Count 2023-2024 Template
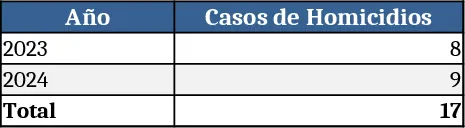
This template is a compact workbook designed to capture, calculate and visualise homicide counts for the province of Santa Cruz across two consecutive years. It contains three main sheets: Data Entry, Calculations, and Dashboard. In the Data Entry sheet you simply type the recorded homicide numbers for each year (2023, 2024). The Calculations sheet automatically sums the figures, computes the year‑over‑year change and flags any increase above a chosen threshold. The Dashboard sheet presents the results in a clean table and a small bar chart, letting you instantly see the total count, the percentage change and the visual trend.
The template solves the common problem of manually aggregating crime data from disparate sources and then having to build ad‑hoc charts each time a new year arrives. By centralising the numbers in a single, formula‑driven file, you eliminate transcription errors, speed up reporting, and gain a ready‑to‑share visual that can be embedded in presentations or briefing notes. It is especially useful for public‑safety officers, municipal analysts, NGOs, or journalists who need a quick, reliable snapshot of homicide trends without learning complex statistical software.
Anyone who monitors community safety, prepares annual crime reports, or supports policy decisions around law‑enforcement resources will find this workbook handy. It helps you keep a clear record of homicide counts, instantly calculate growth rates, and produce a concise visual summary that highlights whether the situation is improving or worsening. The built‑in conditional formatting also draws attention to any sharp rise, making it easier to flag issues for further investigation.
How to use
- Open the Data Entry sheet and enter the number of homicides recorded for 2023 and 2024 in the highlighted cells.
- Switch to the Calculations sheet to review the automatically generated totals, year‑over‑year change and any alerts.
- Go to the Dashboard sheet to see the updated table and bar chart; you can copy the chart into reports or presentations.
- If you need to adjust the alert threshold, edit the cell labeled “Alert % Change” and the sheet will refresh the conditional formatting accordingly.
Expected benefits include a faster turnaround for annual crime summaries, reduced manual calculation effort, and a clearer visual story that supports data‑driven decision‑making.
Similar Templates Recommendation
Secondary School Results and Ranking Template
Track up to 200 secondary students' marks, auto‑calculate grades, averages, divisions and rankings in a clear, formatted sheet.

Couple Budget and Cash Flow Tracker Template
Track monthly income, expenses, and cash flow for a working couple, visualize budgets and savings goals in one spreadsheet.

Date Range and Internal Log Template
Create an Excel file with two columns for dates and internal notes, with colored rows for different date ranges.
