

Dairy Product Depth Analysis Template
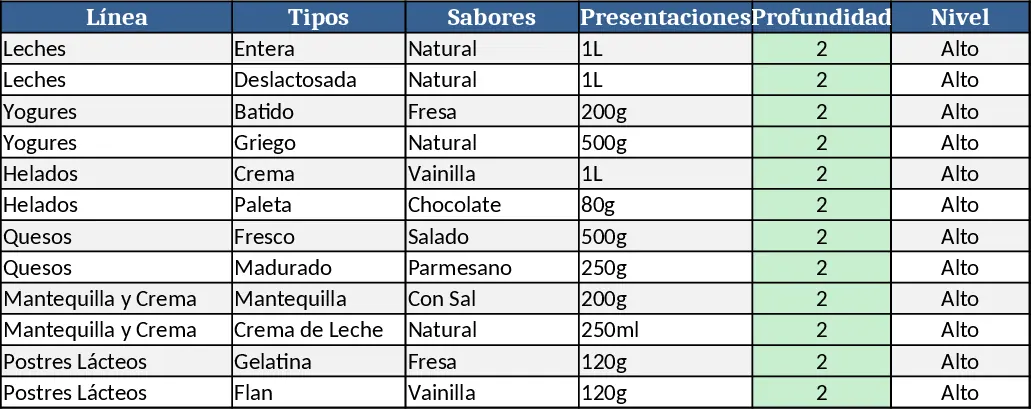
This template lets you map every SKU in your dairy portfolio across six core lines—milk, yogurts, ice‑cream, cheese, butter/cream, and desserts. The workbook is split into three sheets: Product Input, where you list each variant with fields for line, type, flavor, packaging size and unit; Depth Calculator, which automatically counts unique combinations, assigns a depth rating (low, medium, high, very high) and creates a pivot‑style summary; and Visual Dashboard, which displays bar charts and heat‑maps of depth by line, highlighting gaps and over‑concentrated segments. Dropdown menus keep data entry consistent, while conditional formatting flags lines that exceed or fall below target depth levels.
Use it when you need a quick, data‑driven view of how diversified your dairy range is. It solves the common problem of manually scanning product catalogs to spot missing sizes or flavors, helping you prioritize new SKUs, rationalize under‑performing formats, and align product breadth with market‑segment strategies. Brand managers, category analysts, and product development teams in FMCG companies will find it especially valuable during portfolio reviews, launch planning, or competitive benchmarking.
The template tracks the number of variants per line, the distribution of flavors, packaging sizes, and the overall depth score for each category. By visualizing these metrics, you can instantly see where your portfolio is too shallow (e.g., cheese) and where it is overly complex (e.g., yogurts), enabling smarter allocation of R&D resources and clearer communication with sales and supply‑chain partners.
How to use
- Open the Product Input sheet and start entering each SKU: select the product line, choose the type, add flavor (if applicable), and specify the packaging size. The sheet includes dropdowns for line, type and size to ensure consistency.
- Once data is entered, go to the Depth Calculator sheet. The formulas will automatically tally unique combinations and display a depth rating for each line.
- Switch to the Visual Dashboard to view charts that summarize depth across the portfolio. Use the slicers to filter by line or depth level.
- Export the summary tables or charts to PowerPoint or PDF for stakeholder presentations.
Expected benefits: reduces hours spent manually counting SKUs, provides a clear visual of portfolio breadth, and helps you identify quick wins for product line expansion or rationalization.
Similar Templates Recommendation
Secondary School Results and Ranking Template
Track up to 200 secondary students' marks, auto‑calculate grades, averages, divisions and rankings in a clear, formatted sheet.

Couple Budget and Cash Flow Tracker Template
Track monthly income, expenses, and cash flow for a working couple, visualize budgets and savings goals in one spreadsheet.

Date Range and Internal Log Template
Create an Excel file with two columns for dates and internal notes, with colored rows for different date ranges.
