

Photovoltaic System Feasibility Analysis Template
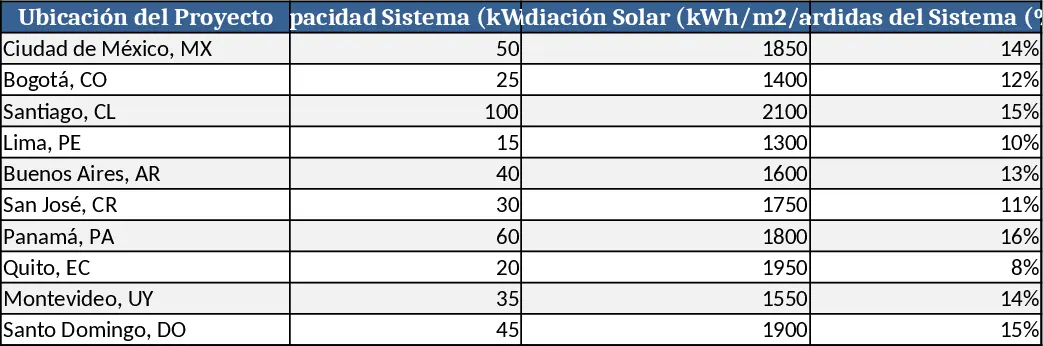
This Excel template is organized into three main sheets: Input Data, Calculations, and Summary Dashboard. In the Input Data sheet you’ll find clearly labeled sections for project basics (location, system size, panel type), capital costs (equipment, installation, permits), operating expenses, and financing assumptions. Drop‑down lists let you choose common financing options (loan, lease, cash) and incentive programs, while date pickers simplify the project start‑up timeline. The Calculations sheet automatically converts the entered data into key metrics such as annual energy yield, degradation rates, net present value (NPV), internal rate of return (IRR), and simple payback period. All formulas are hidden but can be inspected if needed. The Summary Dashboard pulls the most important results into easy‑to‑read charts and tables: a cash‑flow waterfall, a break‑even graph, and a KPI table showing LCOE, CO₂ savings, and profitability ratios.
The template solves the common headache of gathering scattered data and performing manual calculations for solar projects. By centralizing all inputs and instantly generating professional‑grade financial indicators, it speeds up feasibility studies, reduces errors, and provides a clear visual story for stakeholders. It’s especially useful for renewable energy consultants, small‑scale developers, or corporate sustainability teams who need to justify investments quickly and transparently.
Who benefits most? Energy analysts, project managers, and finance officers evaluating new solar installations for commercial, industrial, or community projects. Whether you’re sizing a rooftop array for a warehouse or assessing a ground‑mount farm, the template adapts to any scale and helps you compare scenarios side‑by‑side.
How to use
- Open the workbook and fill out the Input Data sheet – enter location, system capacity, cost items, and select financing options from the drop‑downs.
- Review the Calculations sheet to ensure assumptions (e.g., degradation rate, electricity price escalation) match your market.
- Switch to the Summary Dashboard to see instant visualizations of cash flow, ROI, and environmental impact.
- Export the dashboard as PDF or copy the tables into your proposal to share with investors or internal decision‑makers.
Expected benefits: dramatically cuts the time spent on manual spreadsheet modeling, improves accuracy of financial forecasts, and equips you with ready‑to‑present results that support faster decision‑making.
Similar Templates Recommendation
Secondary School Results and Ranking Template
Track up to 200 secondary students' marks, auto‑calculate grades, averages, divisions and rankings in a clear, formatted sheet.

Couple Budget and Cash Flow Tracker Template
Track monthly income, expenses, and cash flow for a working couple, visualize budgets and savings goals in one spreadsheet.

Date Range and Internal Log Template
Create an Excel file with two columns for dates and internal notes, with colored rows for different date ranges.
