Commercial Points Tracking & Ranking Template
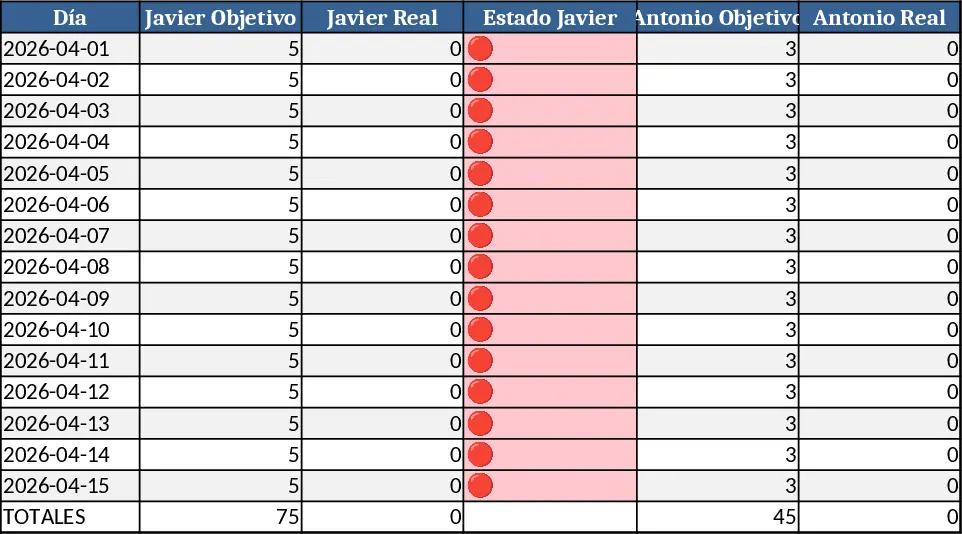
This Excel workbook is built around two tabs that let a sales manager monitor daily point targets for each representative and instantly see how the whole team is performing. The first sheet, SEGUIMIENTO ABRIL, holds a simple table where you list the day, each rep’s objective, the actual points they achieved, and a status column that turns green, orange or red based on how close they are to their goal. Formulas automatically calculate the total points for the day, the team‑wide status, and a summary block at the top that shows each rep’s cumulative real points, the percentage of their overall target reached, and the team’s overall progress. Conditional formatting colors the status cells so a quick glance tells you who is on track and who needs a push.
The second tab, RANKING COMERCIAL, pulls the same data and creates a live leaderboard. It sums each rep’s points, computes a fulfillment percentage, and uses the JERARQUIA (RANK) function to reorder the rows automatically. The ranking sheet also includes a weekly snapshot and a small KPI box for senior management, showing the team’s total objective, real‑time achievement, and the top performer.
This template solves the common problem of scattered daily reports and manual calculations. Instead of copying numbers into a presentation or emailing spreadsheets, the team can open the file before the 9:30 am meeting, review the traffic‑light icons, discuss any deviations, and celebrate the top scorer—all in under ten seconds. It removes the guesswork of whether a rep is meeting their quota, provides a visual cue for quick decision‑making, and keeps motivation high by displaying a transparent ranking.
Anyone who runs a sales floor, from a small boutique shop to a larger regional office, will find this useful. It works best for teams that track point‑based targets (calls, meetings, deals, or any metric that can be expressed as a daily number) and need a fast, visual way to align daily performance with weekly or monthly goals.
How to use:
- Copy the provided table into cell A1 of the "SEGUIMIENTO ABRIL" sheet and fill in each day’s objective and real points for every rep.
- Paste the pre‑written formulas into the first row of each status column (D, G, J, L) and drag them down to cover the whole month.
- Apply the suggested conditional‑formatting rules to the status columns so the traffic‑light icons appear in green, orange or red.
- Look at the summary block at the top for cumulative percentages, then switch to the "RANKING COMERCIAL" tab to see the live leaderboard and weekly KPI snapshot.
Expected benefits include faster daily stand‑ups, reduced manual calculation effort, and clearer visibility into individual and team performance, helping you keep the sales engine running smoothly.
Similar Templates Recommendation
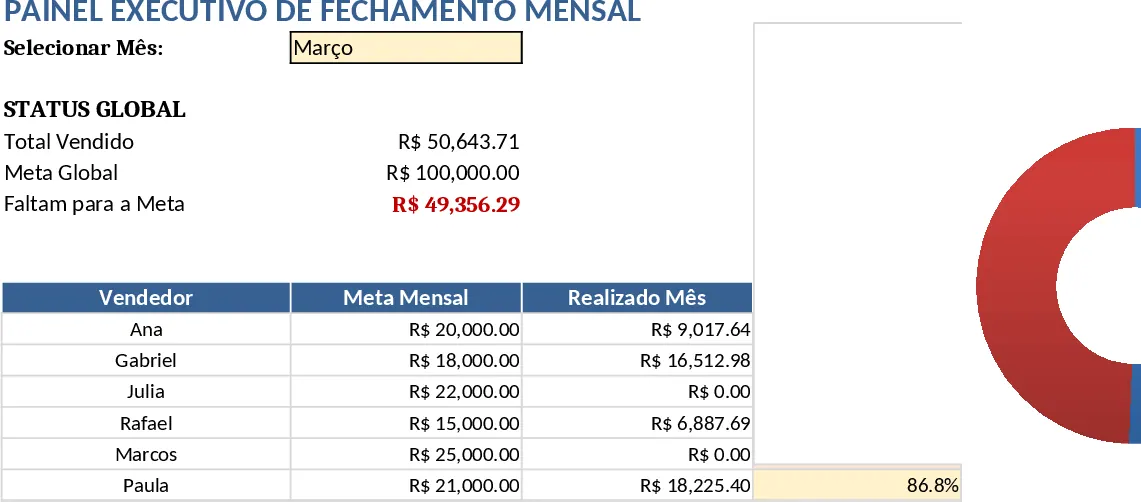
Professional Sales Closing Dashboard Template
A ready‑to‑use Excel dashboard that lets you input monthly sales data and instantly see KPI summaries, trend charts and detailed tables for executive reporting.
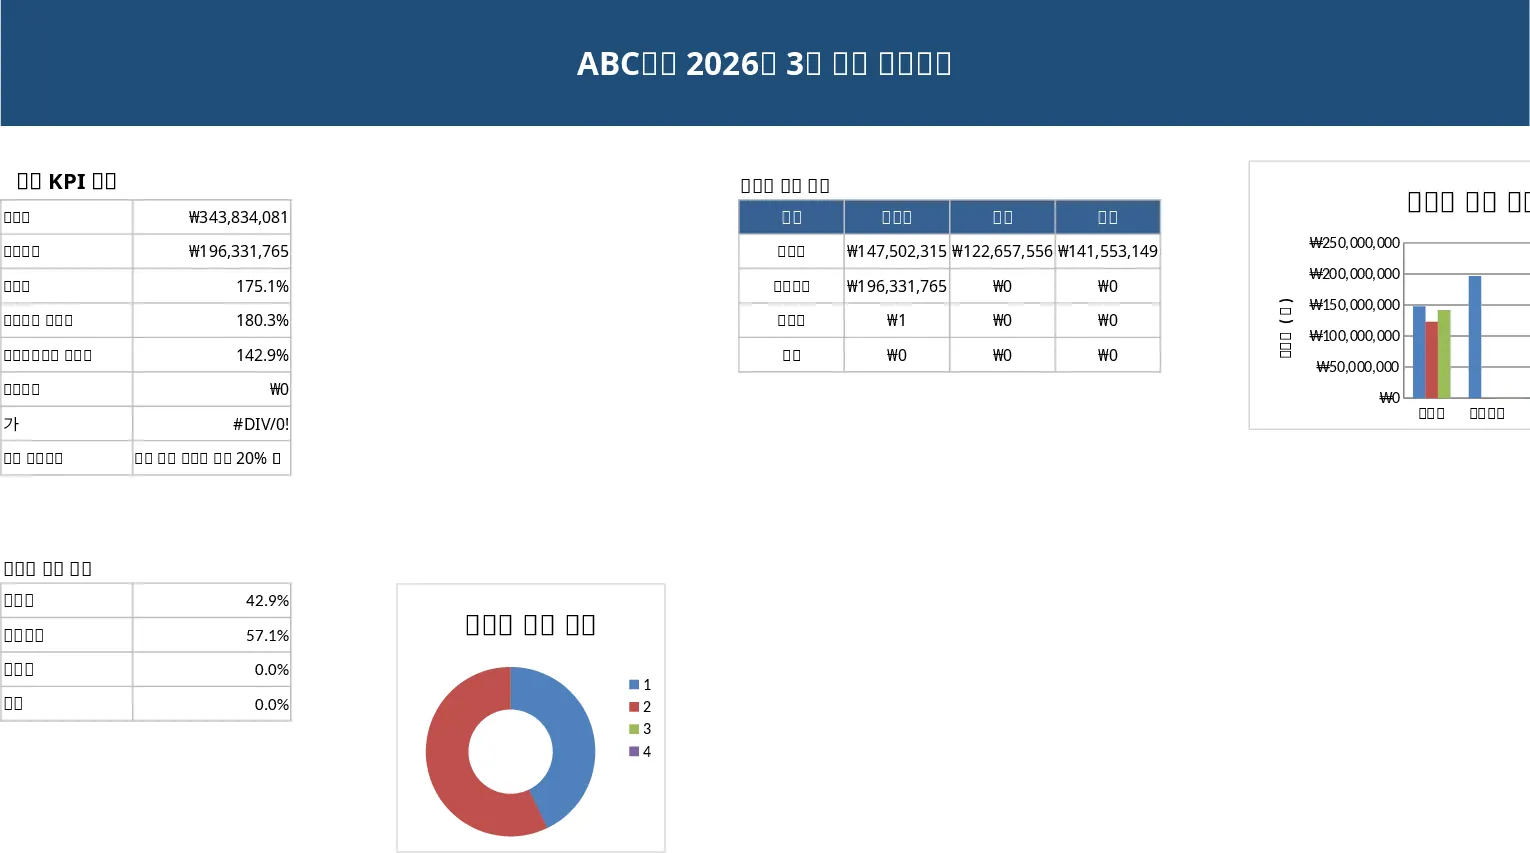
Monthly Business KPI Dashboard with Charts and KPI Cards Template
Advanced monthly business KPI dashboard in Excel that pulls raw data, calculates metrics, and visualizes trends with slicers.
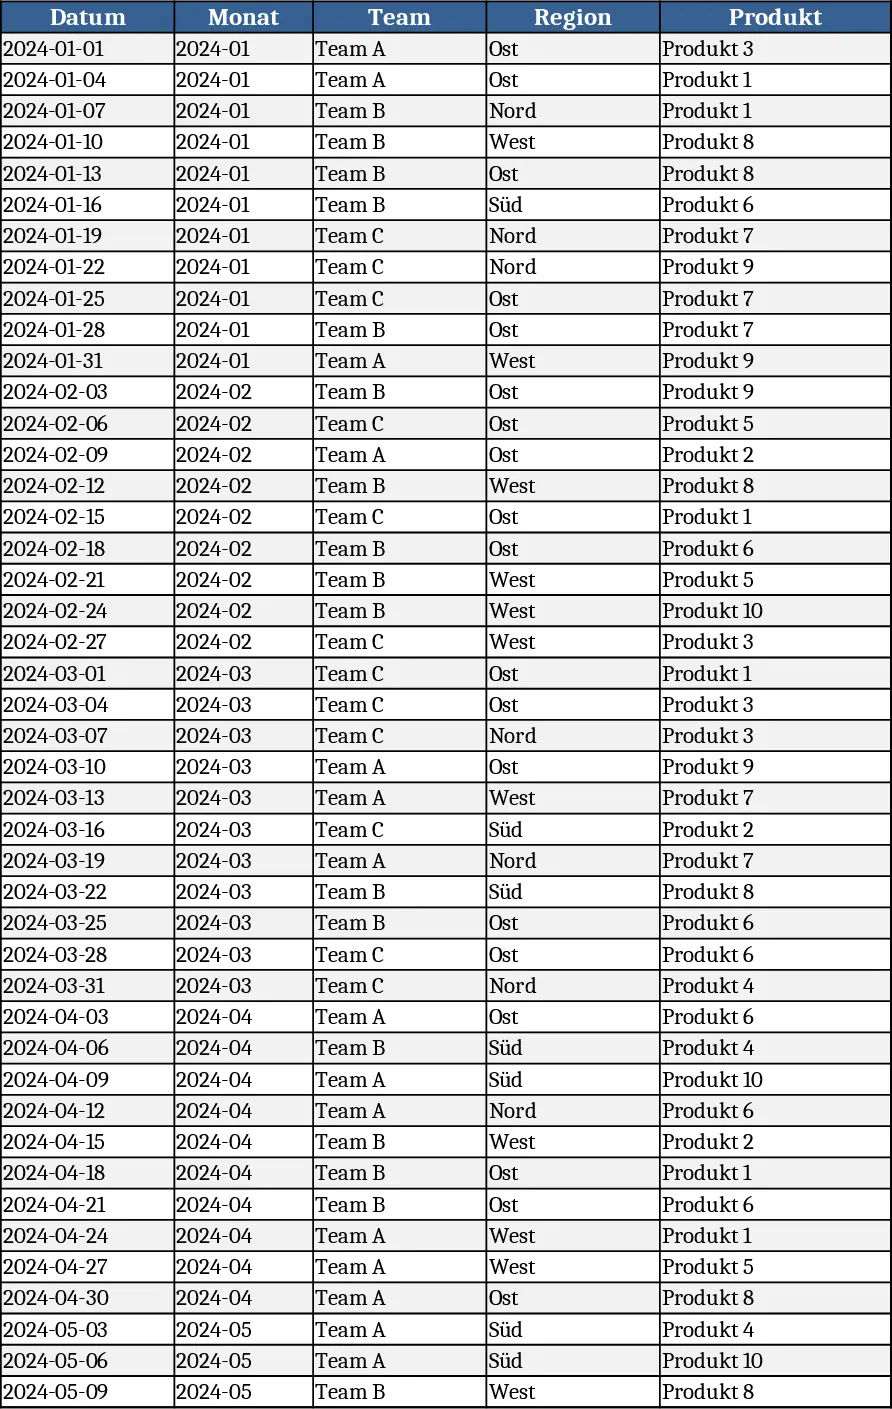
Sales Goal Tracker & Weekly/Monthly Dashboard Template
Track weekly and monthly sales performance with automated dashboards, goal tracking, and error‑proof data entry in one spreadsheet.