Inventory Management Tracker with Dashboard Template
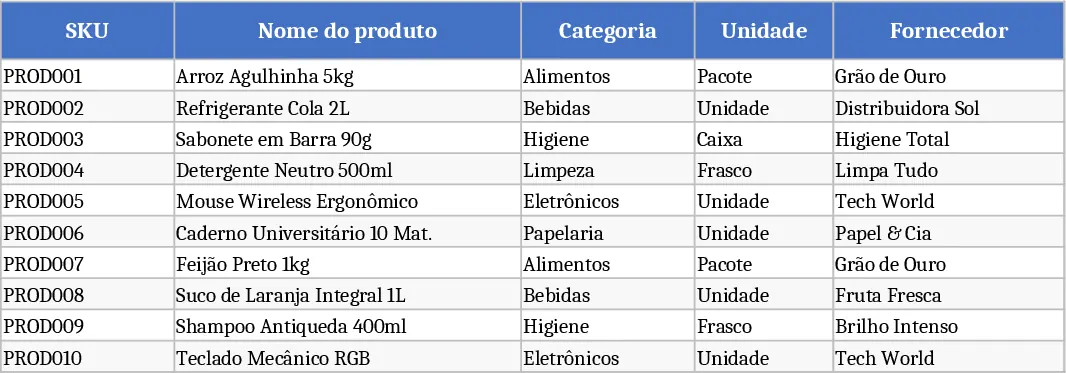
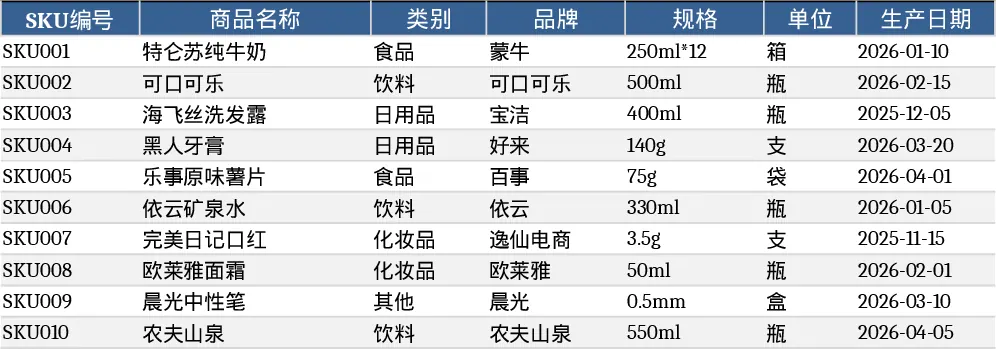
This Excel template is organized into three clear worksheets. The Master Product Data sheet holds a unique SKU, product name, category (chosen from a drop‑down list), unit, supplier, purchase cost, sale price, reorder point and notes, with validation to keep SKUs unique and costs non‑negative. The Stock Movements sheet logs every transaction – date, SKU (selected from the master list), movement type (Entry, Exit, Adjustment), quantity, optional unit cost, reference number, responsible person and comments – and enforces required dates and positive quantities. The Stock Summary sheet pulls data from the first two sheets, showing each SKU’s initial stock, total entries, total exits, adjustments, and the calculated current stock. A conditional format flags any item whose current stock falls at or below its reorder point, displaying a “Reorder” reminder.
Designed for small‑to‑medium businesses, warehouse supervisors, and inventory analysts, this workbook eliminates the guesswork of manual stock tallies. It solves common pain points such as duplicate SKU entries, missed reorder alerts, and time‑consuming reconciliation of inbound and outbound movements. By centralizing product information and transaction history, users gain instant visibility into stock levels, can plan purchases more accurately, and reduce the risk of stock‑outs or overstocking. The template’s built‑in formulas and drop‑downs keep data consistent, while the summary sheet provides a quick dashboard for daily operational decisions.
How to use
- Open the workbook and fill the Master Product Data sheet with your items – you can start by copying the 10 example SKUs provided and adjusting them to your catalog.
- Record each inventory transaction in the Stock Movements sheet, selecting the appropriate SKU and movement type from the drop‑downs; the sheet will automatically compute totals.
- Switch to the Stock Summary sheet to see real‑time stock balances; cells will turn red and show “Reorder” when inventory falls below the defined point.
- Periodically update the initial stock column if you perform a full physical count, and the summary will recalculate automatically.
Expected benefits: streamlined data entry, fewer manual calculations, faster identification of low‑stock items, and overall reduced effort in daily inventory monitoring.
Similar Templates Recommendation
Inventory Management Master & Movement Tracker Template
Track inventory levels, movements, and reorder alerts across products with a three‑sheet Excel workbook that auto‑calculates stock balances.
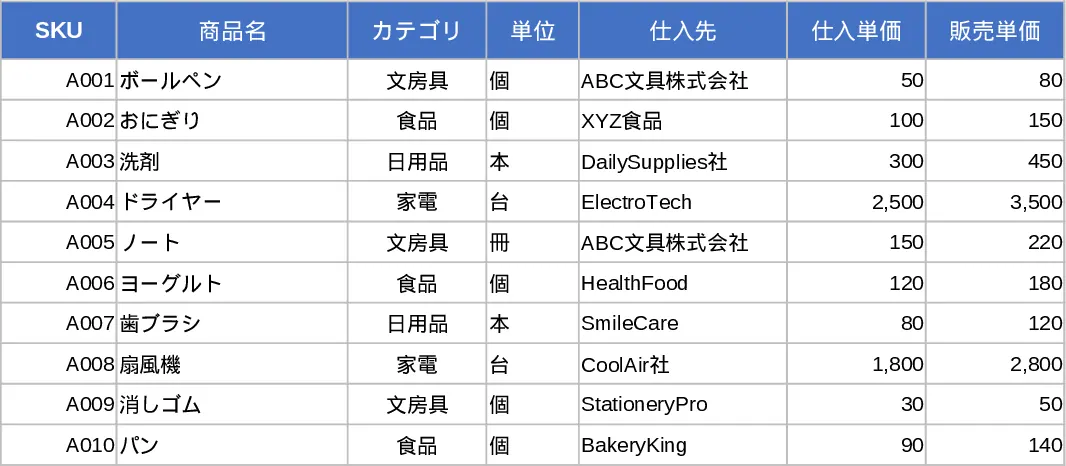
Gestión de Inventario y Movimientos Template
Track stock levels, movements, and reorder alerts with a three‑sheet Excel inventory management template.
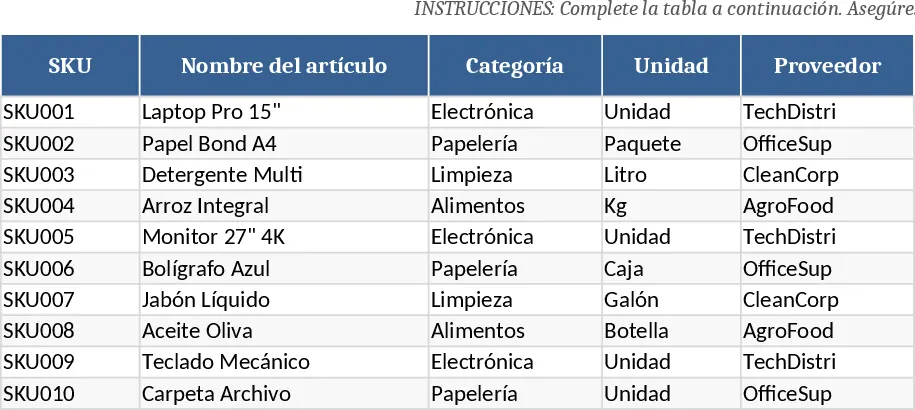
Three‑Sheet Inventory Management with Sample SKUs Template
Track product master data, record inventory movements, and view real‑time stock levels with a ready‑made 3‑sheet Excel template.