Fabric Shop Inventory Management with Dashboard Template
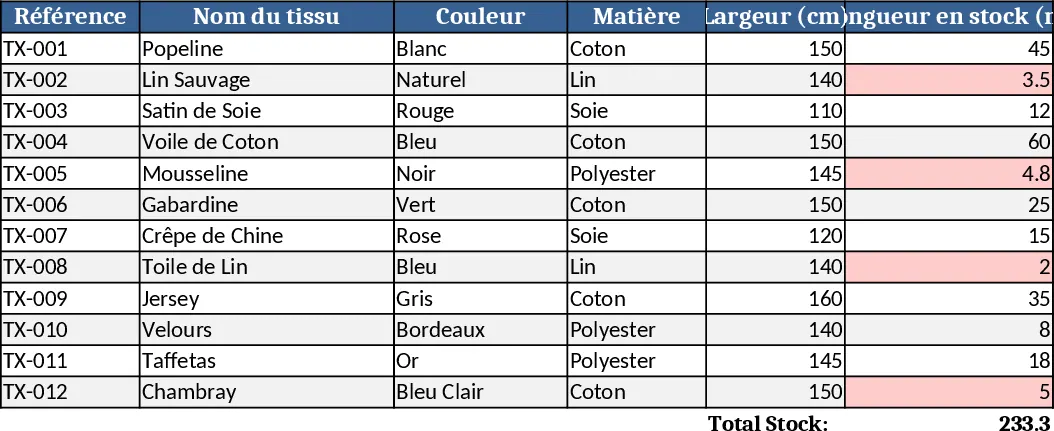
This Excel template is built for a fabric boutique that needs a clear, easy‑to‑use system for monitoring every roll of material on hand. The workbook contains three main sheets: Inventory List, Supplier Directory, and Summary Dashboard. The Inventory List captures each item’s SKU, description, color, pattern, width, yardage, purchase price, current quantity, safety stock level, and a dropdown for status (In Stock, Low, Out of Stock). The Supplier Directory stores contact details, lead times, and preferred fabrics, linked to the inventory via a supplier code. The Summary Dashboard pulls key metrics – total stock value, top‑selling fabrics, items below safety stock, and upcoming reorder alerts – into easy‑to‑read charts and tables.
The template solves the daily headache of manual stock checks and missed reorders that can lead to lost sales. By centralising data, you instantly see which fabrics need replenishment, which are moving fast, and how much capital is tied up in inventory. This visibility helps you negotiate better with suppliers, optimise purchasing decisions, and keep the shop floor tidy. It’s especially useful for boutique owners, inventory clerks, and purchasing managers who juggle multiple fabric lines and need a quick snapshot of stock health without complex software.
What you’ll be tracking includes: individual SKU quantities, valuation of each fabric batch, supplier performance, and reorder triggers. The template also lets you record sales directly on the Inventory List, automatically adjusting quantities and updating the dashboard, so you always have a real‑time picture of both stock and revenue.
How to use
- Open the workbook and fill in the Supplier Directory with names, contact info, and lead times for each vendor.
- In the Inventory List, add a new row for every fabric roll you receive, selecting the appropriate supplier code and status from the dropdowns.
- Record each sale by entering the sold quantity in the “Units Sold” column; the sheet will recalculate remaining stock and flag low‑stock items.
- Switch to the Summary Dashboard to view updated charts, reorder alerts, and total inventory value.
Expected benefits: you’ll spend far less time reconciling paper logs, reduce the risk of stockouts, and gain clearer insight into which fabrics drive revenue, all with a simple Excel file.
Similar Templates Recommendation
Inventory Management Tracker with Stock Tracking Template
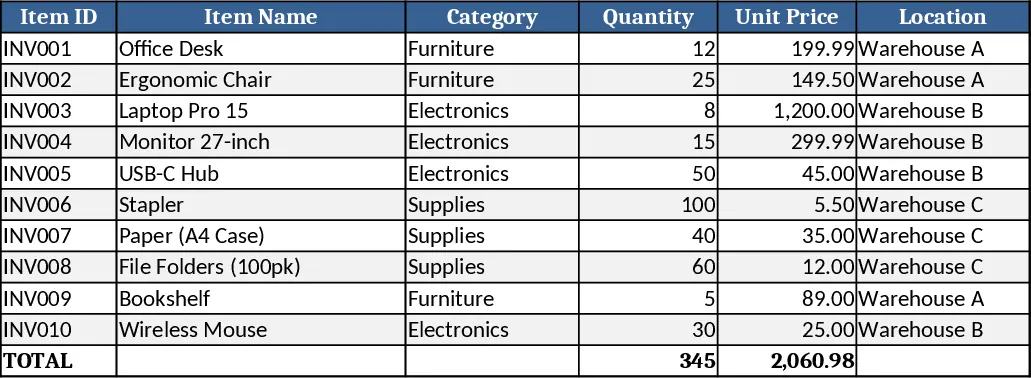
Track current inventory levels, monitor stock movements, and generate reorder alerts with a clear dashboard.
Basic Inventory Tracker Template
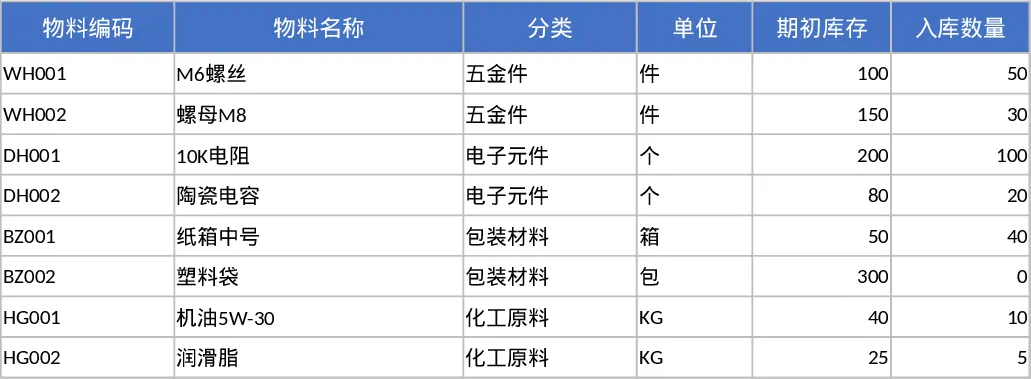
Track stock levels, monitor reorder points, and generate inventory reports with a simple, multi‑sheet Excel template.
Monthly Stock Inventory Tracker Template
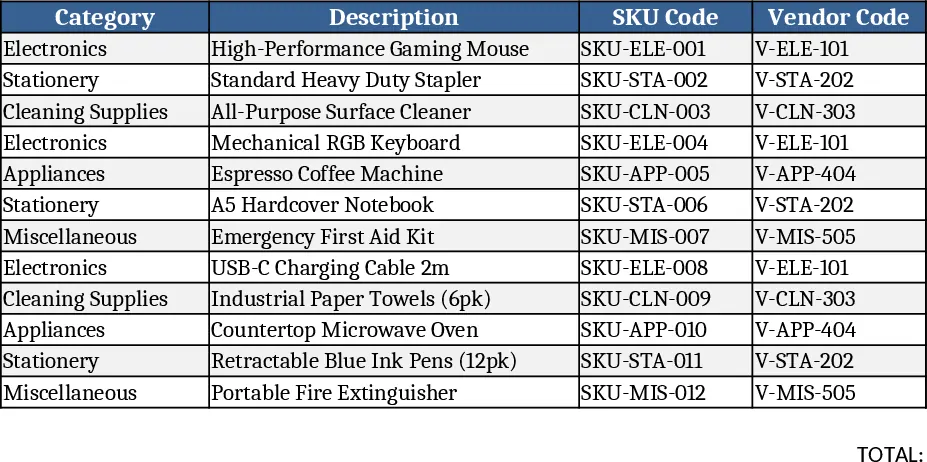
Track monthly stock items with categories, descriptions, SKU, vendor codes, and quantities on hand in a clear, organized sheet.