Financial KPI Dashboard and Reporting Template
This template is a ready‑to‑use workbook that turns raw accounting extracts into a polished financial reporting system. It contains three main sheets: Data Import, where you paste or connect your balance sheets, trial balances, and journal extracts; Model, which houses a Power Pivot data model linking accounts, periods, and cost‑centers with dropdowns for account codes and dates; and Dashboard, a set of PivotTables, slicers, and charts that display revenue, gross margin, net profit, cash‑flow ratios, and other KPIs at monthly, quarterly, and yearly levels. The Dashboard sheet also includes conditional formatting and sparkline visuals, so you can instantly spot trends and outliers.
The workbook solves the common pain points of finance teams that spend hours cleaning CSV exports, manually reconciling accounts, and rebuilding the same calculations for each reporting cycle. By automating data cleaning with Power Query and centralising calculations in DAX measures, the template reduces manual errors, speeds up month‑end close, and provides a single source of truth for management. It is ideal for financial analysts, CFOs, and accounting managers who need fast, accurate insight into performance without learning a full‑blown BI platform.
What you can track with this file includes top‑line sales, cost of goods sold, operating expenses, EBITDA, working‑capital metrics, and variance against budget or prior periods. The built‑in slicers let you drill down by business unit, region, or product line, while the time‑intelligence functions (YTD, QTD, SAMEPERIODLASTYEAR) let you compare results across periods with a click.
How to use
- Open the Data Import sheet and paste your latest trial balance or connect to the source file; the Power Query steps will automatically remove empty rows, promote headers, and add a Period column.
- In the Model sheet, verify that account codes match your chart of accounts; you can add or edit dropdown lists for new accounts.
- Refresh the workbook (Data → Refresh All). The Power Pivot model rebuilds, and all KPI measures update instantly.
- Switch to the Dashboard sheet, use the slicers to filter by department or date, and read the visual summary of your financial health.
Expected benefits: faster month‑end close, fewer manual calculations, and clearer, data‑driven conversations with stakeholders.
Similar Templates Recommendation
Data Extraction Chart Template
Create dynamic extraction charts in Excel to visualize data pulls, track trends, and generate instant visual reports.
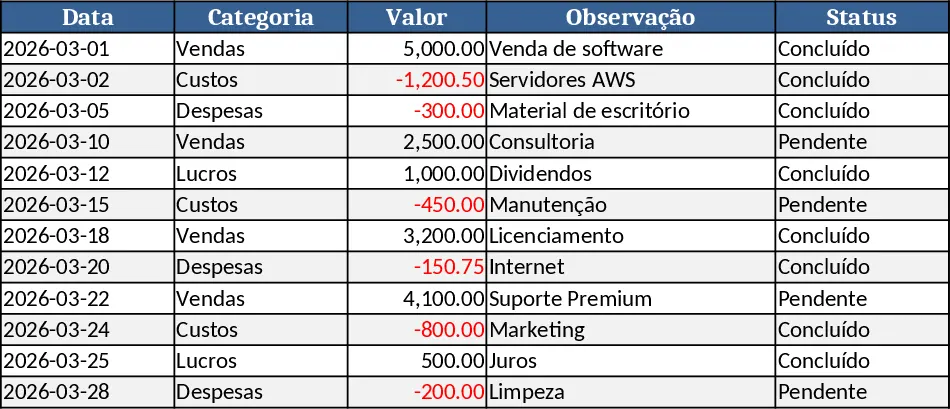
Supplier Management & Invoice Tracking Dashboard Template
Track suppliers, orders, and invoices in one workbook with automated KPIs and visual dashboards for payment performance.
Excel Workbook Design Guide Template
Track and analyze import container costs across multiple currencies, auto-calculate totals, and view a dashboard for quick executive insights.