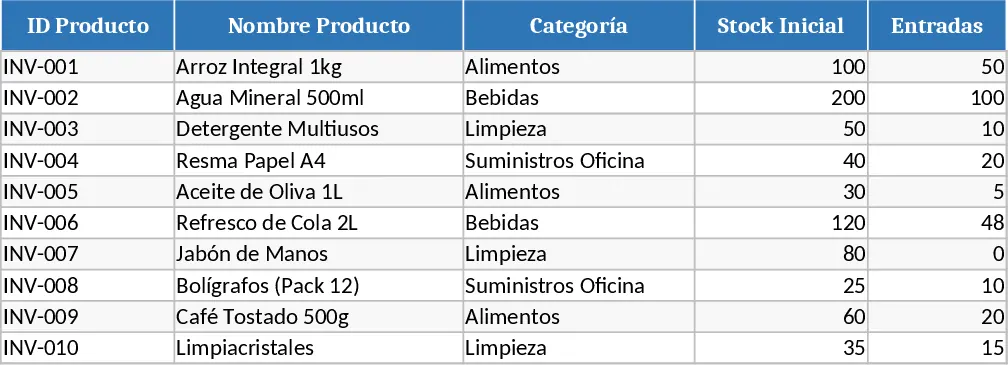
Professional Product Sales Tracker Template
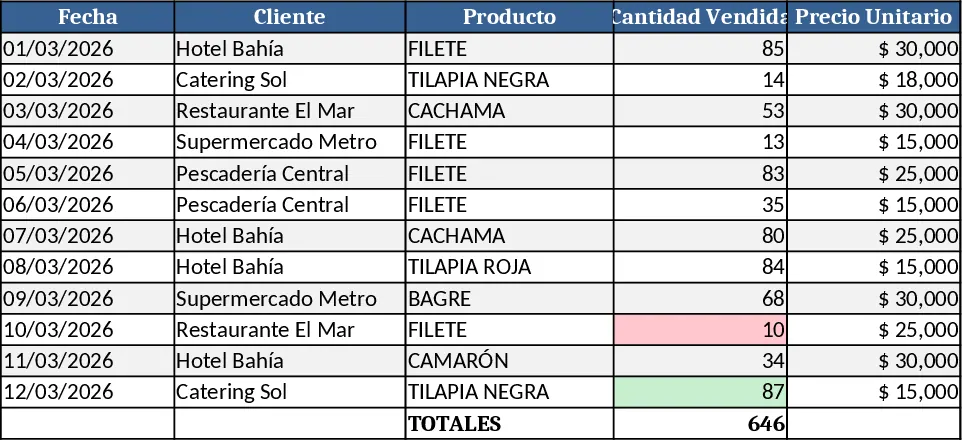
This Excel template is built for anyone who needs a clean, organized way to record daily sales of fish products such as BAGRE, CACHAMA, CAMARÓN, FILETE, HOJITA, TILAPIA ROJA and TILAPIA NEGRA. The workbook contains two main sheets: a Data Entry sheet and a Dashboard sheet.
On the Data Entry sheet you’ll find a formatted table with columns for Product, Quantity Sold, and a calculated Total per Product that multiplies the quantity by a preset unit price (you can edit the price row if needed). The table automatically expands as you add new rows, and a grand total row sums all quantities across products. Conditional formatting highlights the highest‑selling product in green and the lowest‑selling product in red, so you can spot trends at a glance.
The Dashboard sheet pulls the same data and displays a bar chart (or optional pie chart) that updates instantly when you modify the table. The chart is sized for easy presentation and uses soft colors that match the overall design. A small summary box shows the overall quantity sold and the product with the greatest and smallest sales, reinforcing the visual cues from the table.
Who benefits? Sales managers, market analysts, or small business owners in the seafood industry who need to track product performance without complex software. It works perfectly for daily, weekly, or monthly reporting cycles, helping you keep a finger on the most and least popular items.
What it helps you manage? Precise quantity tracking, automatic subtotal calculations, overall sales totals, and visual performance indicators. By centralizing all data in one workbook, you eliminate manual summations and reduce the risk of errors.
How to use:
- Open the Data Entry sheet and select the product from the dropdown list in the Product column.
- Enter the quantity sold for each transaction; the Total per Product column updates automatically.
- Review the grand total at the bottom of the table and the highlighted rows for best‑ and worst‑selling items.
- Switch to the Dashboard sheet to see the chart refresh in real time and to view the summary box for quick insights.
Expected benefits: Saves time on manual calculations, provides instant visual feedback on sales trends, and improves decision‑making with clear, up‑to‑date data.
Similar Templates Recommendation
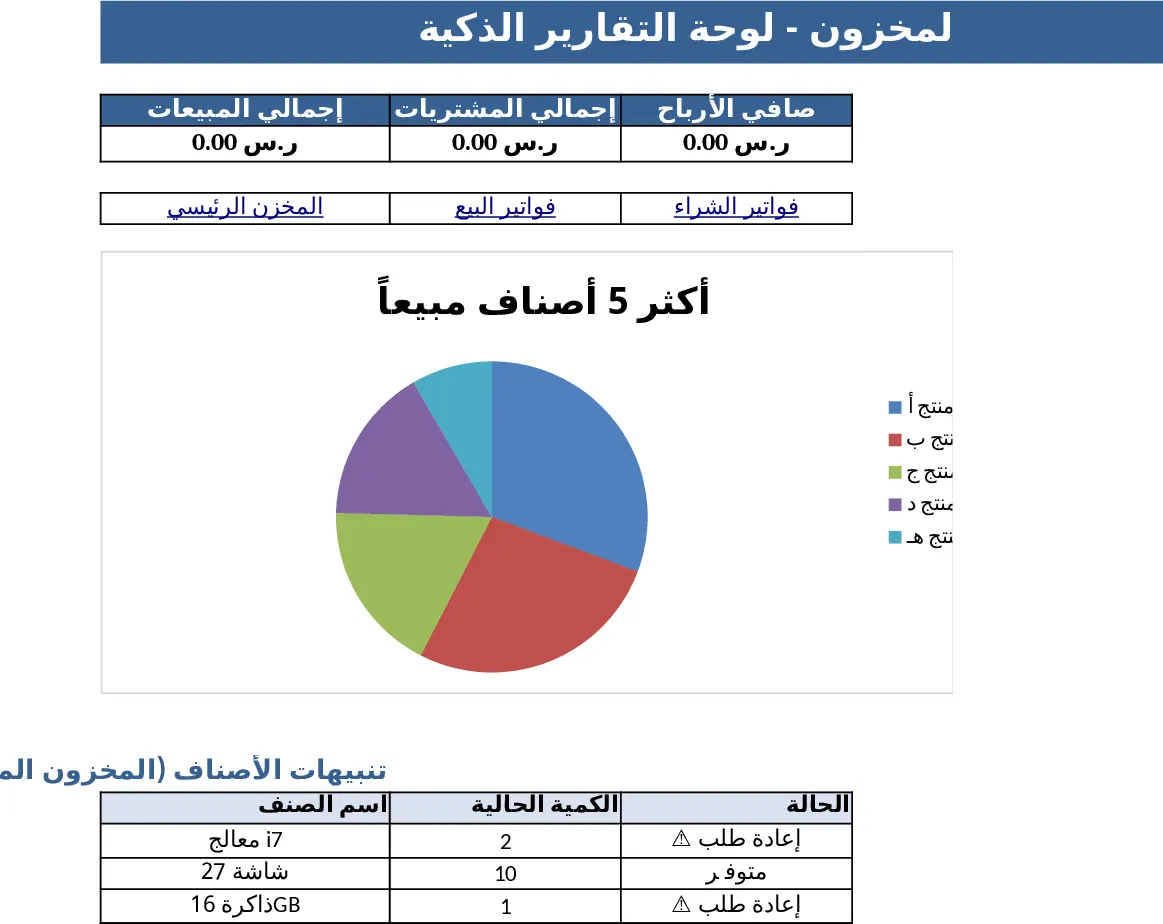
Professional Inventory & Invoicing Management Dashboard Template
Professional Excel workbook for inventory control and full accounting, with dashboards, purchase & sales invoices, and real‑time stock tracking.
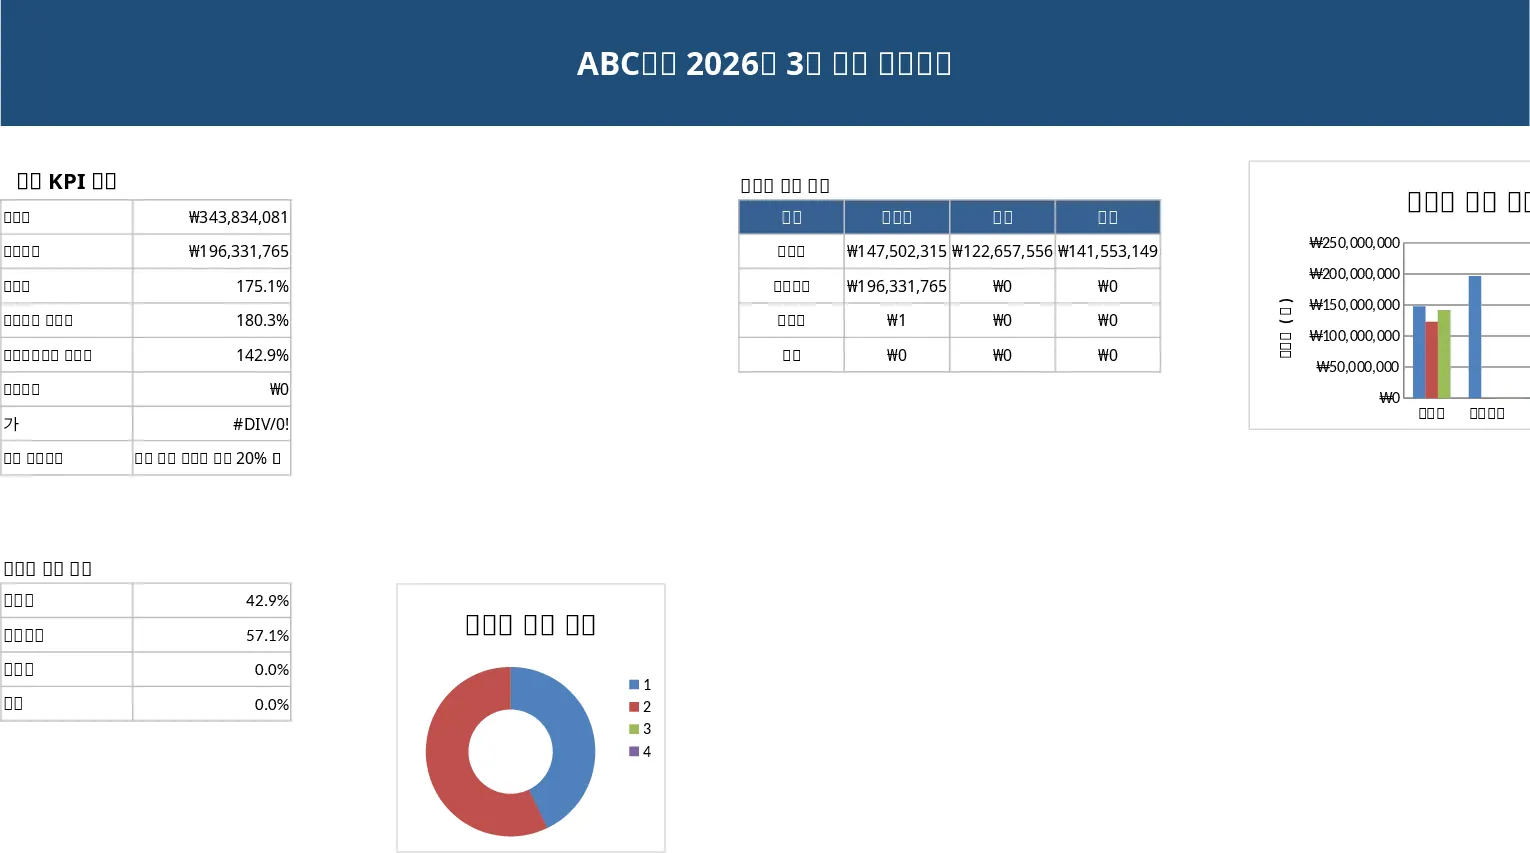
Professional Sales Closing Dashboard Template
A ready‑to‑use Excel dashboard that lets you input monthly sales data and instantly see KPI summaries, trend charts and detailed tables for executive reporting.
Inventory Management and Automated Sales Tracker Template
Track inventory levels, record incoming and outgoing stock, and generate automated sales reports in one Excel workbook.