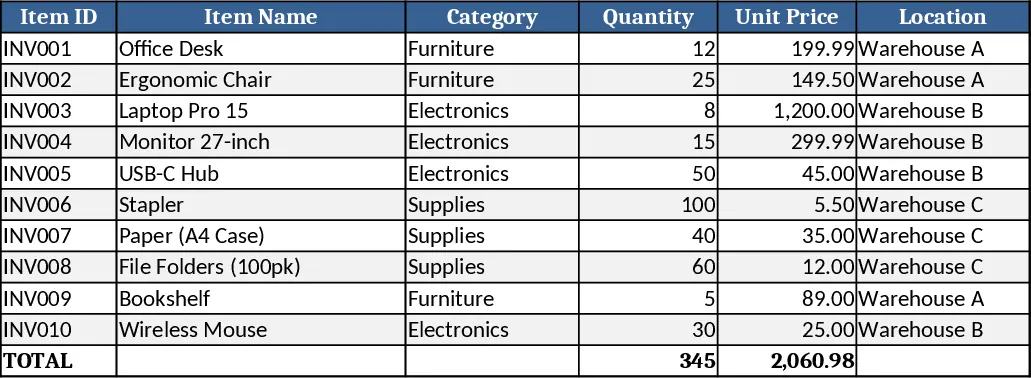
Inventory Control Tracker Template
This inventory control template is organized into three main sheets: a Product List, a Transactions Log, and a Dashboard. The Product List holds static data such as SKU, description, unit cost, minimum stock, and supplier details, with dropdowns for category and location. The Transactions Log records every inbound and outbound movement, automatically calculating current balance per SKU using built‑in formulas. The Dashboard pulls key metrics—total stock value, items below reorder point, and monthly turnover—into easy‑to‑read charts and summary tables.
Designed for small‑to‑medium businesses, warehouse staff, and shop owners, the template solves the headache of manual stock tallies and missed restock alerts. By centralizing all inventory data in one workbook, users eliminate duplicate entries, reduce errors, and gain instant visibility into which products need replenishment. The real‑time calculations mean you always know the exact quantity on hand, helping you avoid stockouts or excess holding costs.
Anyone who handles physical goods—store managers, procurement officers, logistics coordinators—can benefit from this tool. It works especially well in scenarios where a simple, low‑cost solution is preferred over complex ERP systems. The template tracks each SKU’s movement, flags items that fall below their safety stock, and produces a concise summary that can be shared with suppliers or senior management.
To get started, follow these steps: 1) Open the workbook and fill the Product List with your items, selecting categories and locations from the provided dropdowns. 2) Record each purchase or sale in the Transactions Log, entering date, SKU, quantity, and transaction type. 3) Refresh the Dashboard (or simply open the sheet) to see updated charts, low‑stock alerts, and total inventory value. 4) Adjust the reorder point column as demand patterns change, and the template will automatically highlight items needing attention.
The template also includes conditional formatting that colors rows red when stock drops below the minimum level, making it easy to spot problems at a glance. Pivot tables on the Dashboard let you slice data by month, supplier, or product category, giving deeper insight without extra effort.
Expected benefits: smoother daily inventory checks, fewer manual calculations, quicker reorder decisions, and a clearer picture of stock health, all saving time and reducing the risk of costly stock errors.
Similar Templates Recommendation
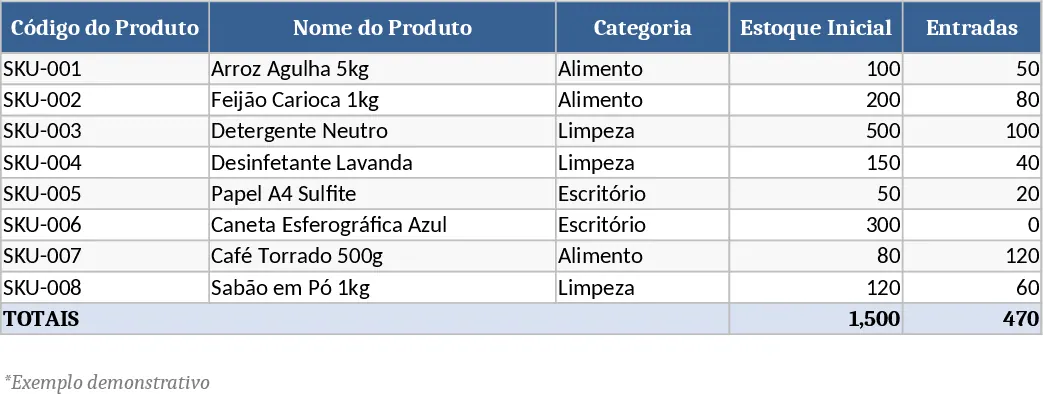
Comprehensive Inventory Management Tracker with Sample Data Template
Track items, movements, and stock levels with automatic reorder alerts in a three‑sheet Excel template.
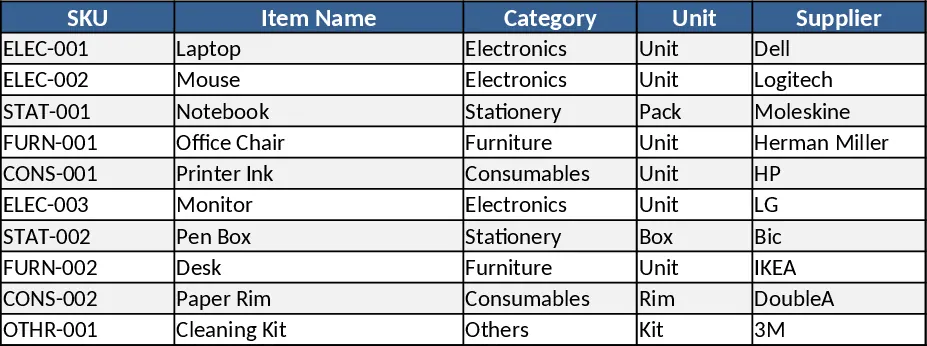
Inventory Management Tracker with Category Breakdown Template
Track product stock levels, movements, and reorder alerts in a three‑sheet Excel template with master data, transaction log, and summary.
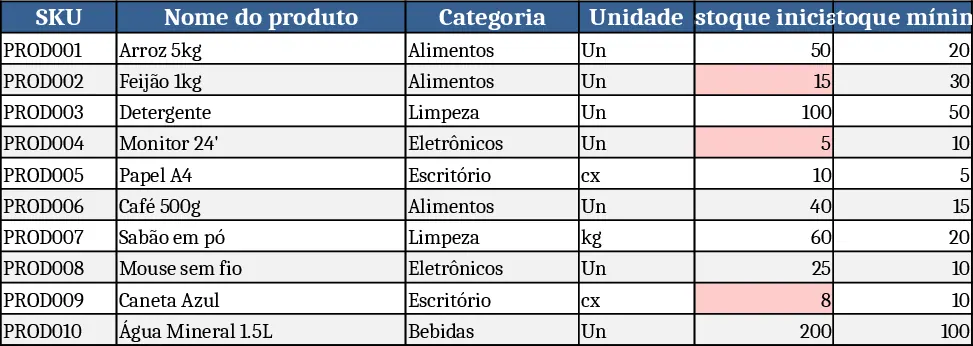
Basic Inventory Tracker Template
Track stock levels, monitor reorder points, and generate inventory reports with a simple, multi‑sheet Excel template.