Client Portfolio Control Dashboard with Monthly Updates Template
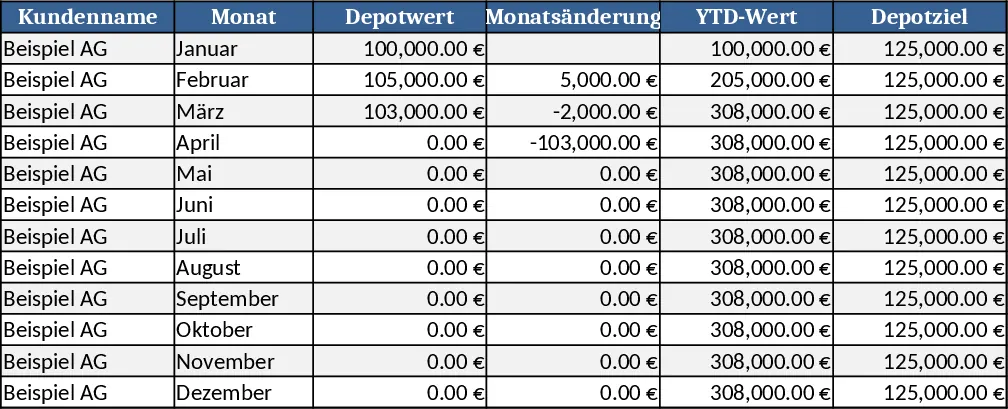
This Excel template is built for financial advisors, wealth managers, or anyone who needs to keep a clear eye on multiple client portfolios. The workbook is divided into three main sheets: a Master Overview, a Monthly Update table, and a set of Client Detail tabs that are automatically generated for each customer. The Master Overview pulls key figures from every client sheet – total assets, net gains, risk rating, and upcoming actions – and presents them in a compact dashboard with slicers for quick filtering by region, asset class, or advisor. The Monthly Update sheet lets you enter the latest balances, contributions, and withdrawals for each client, and the template instantly recalculates performance metrics and updates the Master Overview. Each Client Detail tab contains a chronological ledger, performance charts, and a summary block that mirrors the data shown in the master view, so you can dive into a single client’s history without leaving the file.
The template solves the common problem of scattered data and manual consolidation. Instead of copying numbers from separate statements into a Word report, you enter the raw figures once and let the workbook do the heavy lifting. It saves time, reduces transcription errors, and gives you a professional‑looking snapshot that can be shared with clients or used for internal reviews. By having both a high‑level view and granular client pages, you can spot portfolio trends, identify under‑performing assets, and prepare monthly performance letters in minutes.
Ideal users are financial consultants, private bankers, or portfolio managers who handle dozens of client accounts and need to report on them regularly. Whether you are preparing a quarterly board meeting, sending monthly performance updates to clients, or simply monitoring risk exposure across your book of business, this template provides the structure and automation to keep everything organized.
The workbook helps you track total assets under management, individual client balances, monthly inflows/outflows, return on investment, and risk metrics. It also produces visual charts that compare current performance against targets, making it easy to communicate results to stakeholders.
How to use
- Open the file and go to the Monthly Update sheet. Enter the latest balance, contribution, and withdrawal figures for each client in the provided table.
- Switch to the Master Overview – the dashboard will refresh automatically, showing updated totals, performance percentages, and any alerts you set up.
- Click on a client name in the overview to jump to that client’s detail tab, where you can add notes, view historical charts, and adjust assumptions.
- Export the Master Overview or any client tab as PDF to send to stakeholders, or copy the charts into presentations.
Expected benefits include faster month‑end reporting, fewer manual calculations, and a clearer picture of portfolio health across all clients.
Similar Templates Recommendation
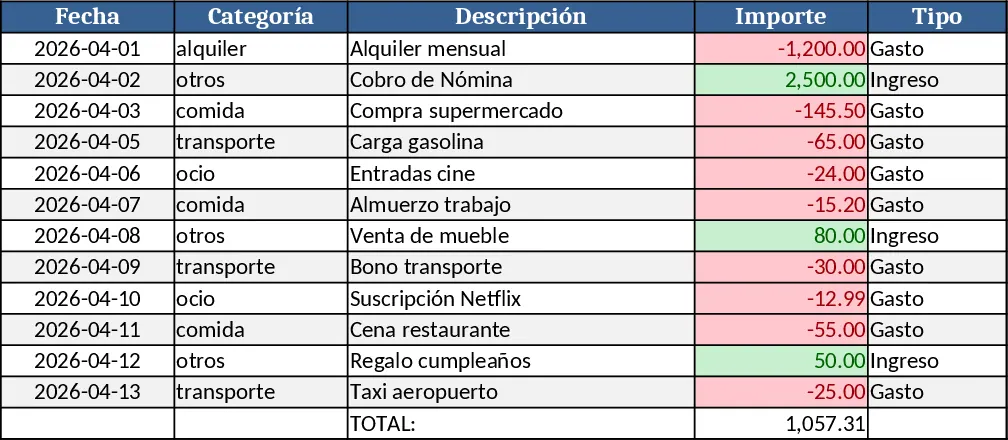
Monthly Budget Tracker with Charts Template
Track monthly income and expenses, visualize cash flow with built‑in charts, and see summaries at a glance.
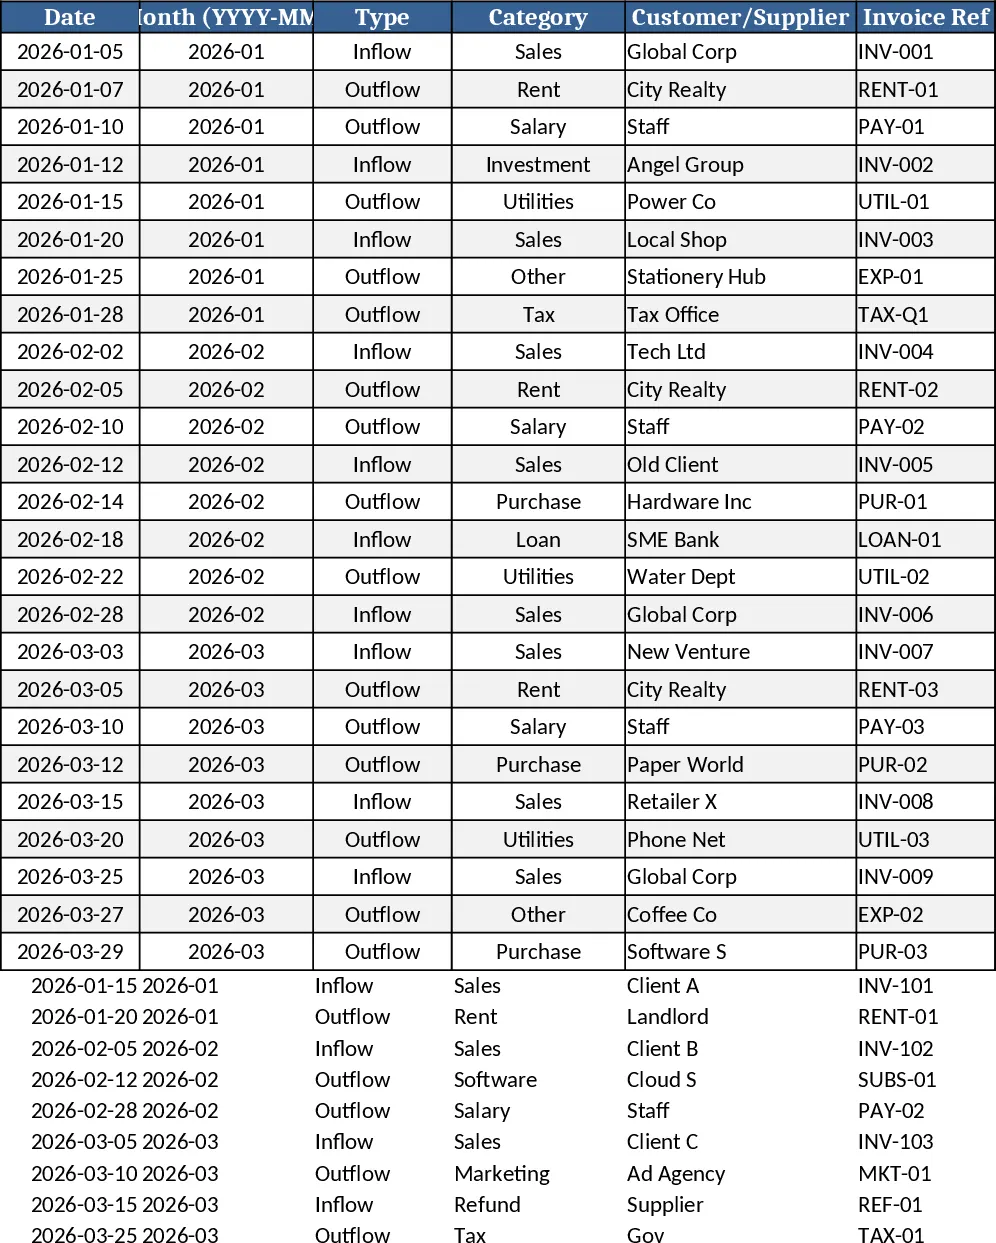
Small Business Cash Flow Tracker with Transaction Log Template
Track daily cash inflows and outflows, see monthly net cash flow and ending balances, and visualize trends with charts in a single workbook.
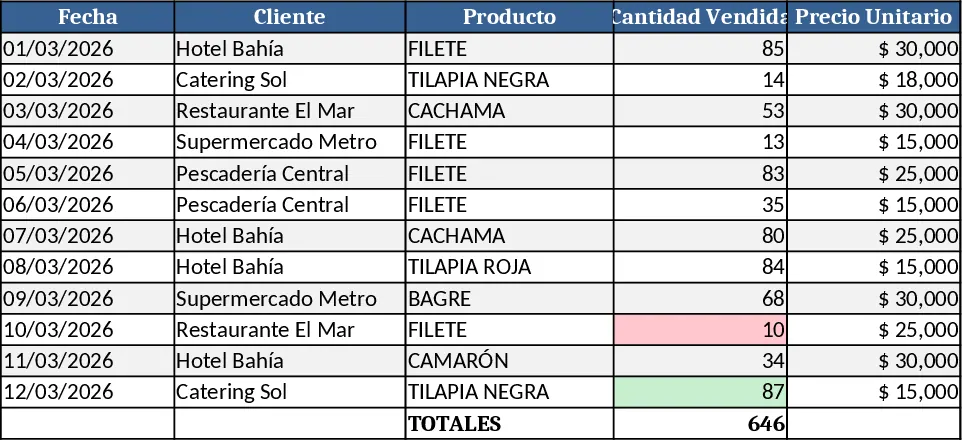
Professional Product Sales Tracker Template
Professional Excel template to log, calculate and visualize sales of fish products, with auto totals, dynamic charts and visual highlights.