If you regularly rebuild sales, finance, or operations spreadsheets, AI can help with the structure, formulas, summaries, and charts. The important part is not asking for “a spreadsheet.” It is giving the AI a real file, a clear business outcome, and rules you can verify before sharing the result.
This guide shows a practical workflow for turning an Excel or CSV export into a reviewable workbook with Excel AI. You will also get a prompt you can copy and a checklist for catching errors before the spreadsheet becomes part of a report.
Key takeaways:
- Start with a real Excel or CSV file and describe the decision or report the spreadsheet must support.
- Ask for exact columns, formulas, summaries, and charts instead of using a vague one-line request.
- Review source totals, formulas, dates, categories, and chart ranges before exporting or sharing the workbook.
- RowSpeak helps turn business files into answers, reports, and dashboards while keeping the result open to review and correction.
What can AI do when creating an Excel spreadsheet?
AI is useful for organizing columns, proposing formulas, creating summary tables, and explaining what the numbers mean. It can also help reshape a messy export into a cleaner report or an Excel-to-dashboard workflow.
AI does not remove the need for review. A formula can be syntactically correct and still use the wrong business rule. A chart can look polished while pointing to an incomplete range. Treat the first result as a working draft that you validate against the source file.
Step 1: Define the spreadsheet outcome
Start with the decision the spreadsheet needs to support. For example, a sales operations manager may have a file named sales-export.xlsx and need a monthly report that shows revenue, cost, gross profit, and regional performance.
Write down four things before prompting the AI:
- Input: the file and the sheet that contains the raw data.
- Output: the table, report, or dashboard you need.
- Rules: the formulas, date range, grouping, and filters to apply.
- Review standard: the totals and fields that must match the source.
Step 2: Prepare the source file
Keep the raw data in a simple table with one header row. Avoid merged cells, blank header names, and totals mixed into transaction rows. A useful sales export might look like this:
| Column | Example | Review check |
|---|---|---|
| Order Date | 2026-07-01 | Stored as a real date |
| Region | West | Labels use one consistent spelling |
| Product | A-100 | Product codes remain text |
| Revenue | 12,500 | Values are numeric |
| Cost | 7,200 | Values are numeric |
If the file contains sensitive finance, payroll, or customer data, use an anonymized copy or your organization’s approved data environment.
Step 3: Give the AI a precise prompt
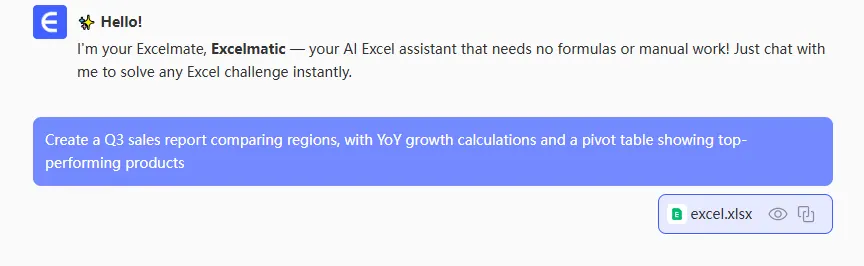
Upload the file, then use a request that specifies both the calculation and the expected output.
Using the Raw Data sheet in this workbook:
1. Preserve the original data without changing its values.
2. Add a Gross Profit column calculated as Revenue minus Cost.
3. Create a monthly summary by Region with Revenue, Cost, and Gross Profit.
4. Add a chart comparing monthly revenue by Region.
5. List any missing dates, blank region labels, or non-numeric Revenue and Cost values.
6. Explain the formulas and assumptions used.
Do not invent missing values. Ask me before choosing an unclear business rule.
This prompt gives the spreadsheet assistant a defined source, calculation, output, and error-handling rule.
Step 4: Review and refine the workbook
Check the result before asking for cosmetic changes. Use this review order:
- Source integrity: the raw rows and values have not changed unexpectedly.
- Totals: total Revenue and Cost match the source data for the same date range.
- Formulas: Gross Profit uses Revenue minus Cost in every populated row.
- Dates and categories: months, regions, and products are grouped consistently.
- Charts: the chart uses the complete summary range and the correct units.
- Assumptions: no missing value or business rule was silently invented.
If something is wrong, make one correction request at a time. For example: “Keep blank Region values in an Unassigned group and recalculate the summary,” or “Use calendar month, not a rolling 30-day period.”
The following demonstration shows how a request can be turned into a report that remains available for review and refinement.
Step 5: Export, share, and reuse the workflow
After the checks pass, export the workbook and keep the prompt with the reporting process. For a recurring monthly workflow, replace the source export, reuse the same instructions, and repeat the same validation checks.
This is where a file-based tool such as RowSpeak differs from a generic chat answer. The useful output is not only a formula suggestion; it is a workbook, report, or dashboard that your team can inspect, correct, and share.
Common mistakes to avoid
- Asking “make me a dashboard” without naming the source, metrics, or audience.
- Accepting a polished chart before reconciling the underlying totals.
- Mixing percentages, currency, and text in the same source column.
- Letting the AI guess fiscal periods, margin definitions, or missing values.
- Replacing a controlled Excel or BI process without checking whether the AI workflow meets the same review requirements.
Your next step
Choose one real Excel or CSV export and write down the output, rules, and checks before uploading it. Then use the prompt above as a starting point. If the final deliverable is a recurring management report or visual summary, continue with RowSpeak’s Excel-to-dashboard workflow and keep the review checklist as part of the process.