The best AI tool for Excel data analysis is not the one with the longest feature list. It is the one that fits the file, the task, and the output your team must review.
A finance analyst may need a variance explanation from three messy exports. A sales manager may need a dashboard from a CRM CSV. A spreadsheet specialist may only need help writing a formula inside an existing workbook. Those are different jobs, and a useful comparison should not treat them as identical.
This guide compares 12 common options and categories for 2026. Product capabilities and plan availability change frequently, so verify current vendor documentation before a purchase or rollout. RowSpeak claims below are tied to recorded repository evidence; other products are explicitly labeled when this article relies on vendor documentation instead of an independent run.
Key takeaways:
- If the workbook itself must be delivered, start with an Excel-native assistant; if the work starts with several exports and ends with a management pack, test a file-to-report tool; if metrics must refresh from live systems for many users, evaluate BI.
- Rank tools on a controlled fixture, not a vendor demo: seed five known data defects, calculate two control totals independently, and record misses, false positives, reviewer corrections, and repeatability on a renamed-column version.
- Do not turn a published upload limit into a performance claim. A valid 50 MB comparison uses the same data, account tier, network, prompt, and acceptance criteria, and reports failures as well as successful outputs.
- RowSpeak’s clearest fit is messy-file analysis that must become a reviewable answer, report, or dashboard—not every formula task, workbook model, or enterprise BI workload.
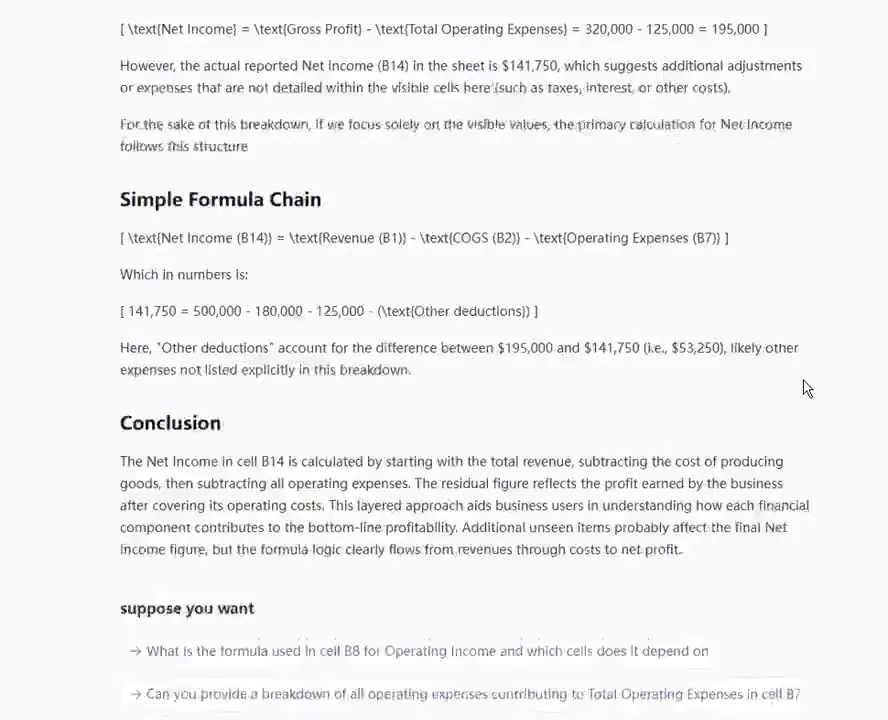
- Recorded RowSpeak runs produced useful analysis, charts, audits, dashboards, and workbooks, but also exposed mixed date types, an unsupported explanation for a
53,250residual, and incomplete chart areas. Those failures belong in the buying decision.
How to compare AI tools for Excel data analysis
Use the same questions for every option:
- What files can the team start with? Excel alone is different from Excel plus CSV exports, PDFs, screenshots, or image-based tables.
- Where does the work happen? Inside a workbook, in a chat interface, in a reporting workspace, or in a BI model?
- What is the final output? A formula, cleaned data, analysis, a chart, a dashboard, or a recurring management report?
- How will the result be reviewed? Can a teammate check definitions, rows, exceptions, and the final summary?
- How often will the workflow repeat? A one-off question needs less structure than a monthly report.
Below is a practical comparison. It does not claim that one product is best for every task.
How this comparison was researched
This article uses three evidence levels:
- Observed RowSpeak demonstrations: repository-hosted product recordings show a prompt being submitted, an analysis being produced, and downloadable results. Screenshots from those recordings appear below.
- Vendor-described capability: competitor positioning is limited to the surface and workflow described in current vendor documentation. Pricing, plan access, model behavior, and file limits can change.
- A test protocol you can reproduce: the benchmark design below is a recommendation. It is not a claim that all 12 tools were timed on the same 50 MB file.
This is deliberately narrower than many “best tools” lists. Without identical source files, plan tiers, prompts, network conditions, and expected answers, a speed number creates false precision.
1. RowSpeak
Best for: Teams turning Excel, CSV, PDF, screenshots, and exported business data into reviewable answers, reports, and dashboards.
RowSpeak is a strong fit when the work begins with messy files and ends with a result that must be discussed or shared. Instead of treating analysis as a one-question chat, it supports a path from file cleanup and metric checks to charts, written summaries, and recurring reporting.
Use it when a weekly KPI review or monthly management report has become too manual for Excel alone but does not justify a large BI implementation.
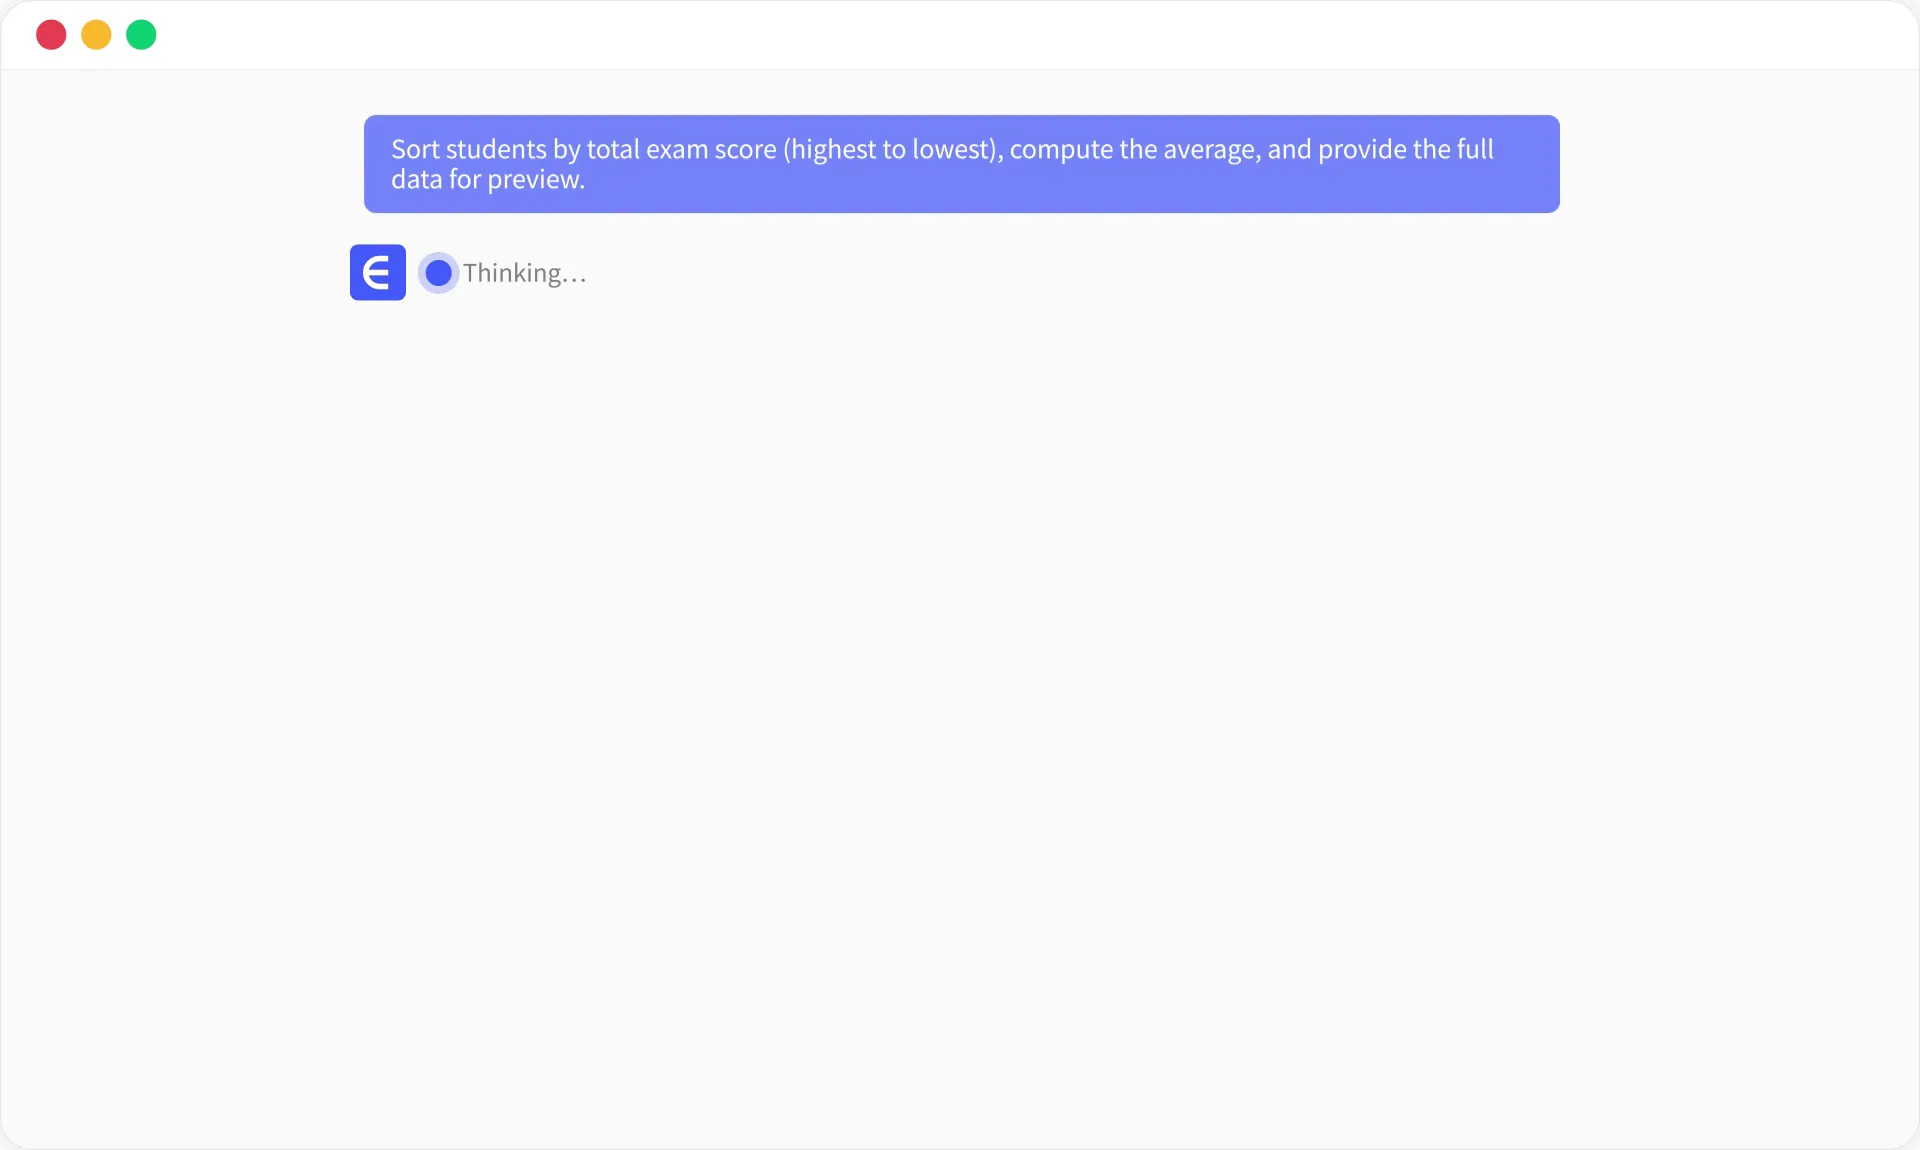
In the recorded example below, a workbook containing 101 student records was paired with a concrete instruction: sort by total score, calculate the average, and provide the data for preview.
The returned result states the method, reports an average of 49.85, describes the distribution, and provides a downloadable workbook.
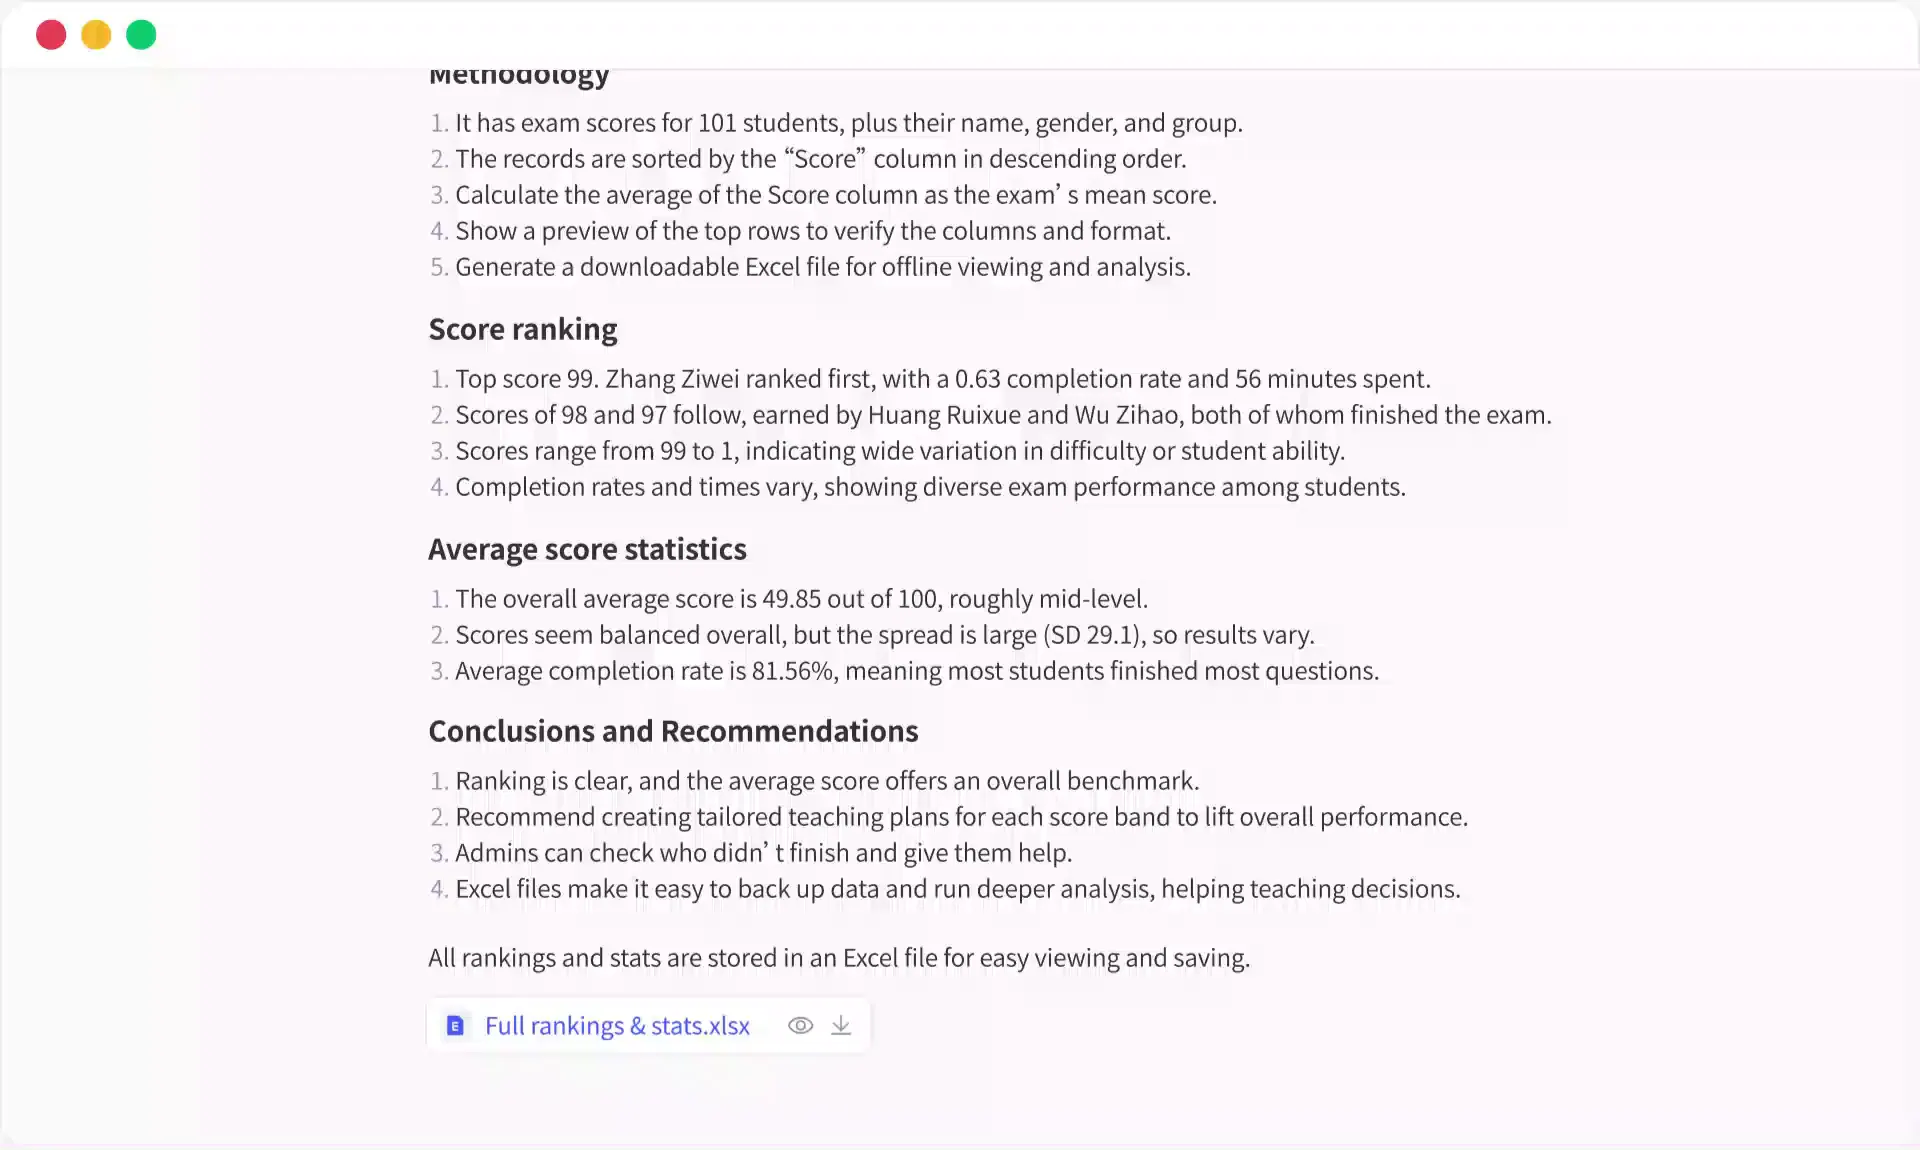
This is useful workflow evidence, but it is not enough to accept the analysis. A reviewer should independently recompute the row count, mean, and standard deviation; check whether blanks were excluded; and reject qualitative phrases such as “mid-level” unless the organization has defined score bands.
Recorded RowSpeak execution ledger
These observations come from repository-hosted product demonstrations, some recorded under the previous Excelmatic name. Excelmatic is now RowSpeak. They establish that the workflow surfaces exist; they do not establish cross-vendor accuracy or speed.
| Task | Concrete result visible | Failure or missing validation | Evidence verdict |
|---|---|---|---|
| Analysis | 101 records, mean 49.85, standard deviation 29.1, ranked output, downloadable workbook |
Standard-deviation convention and independent recalculation not captured | Result observed; accuracy unverified |
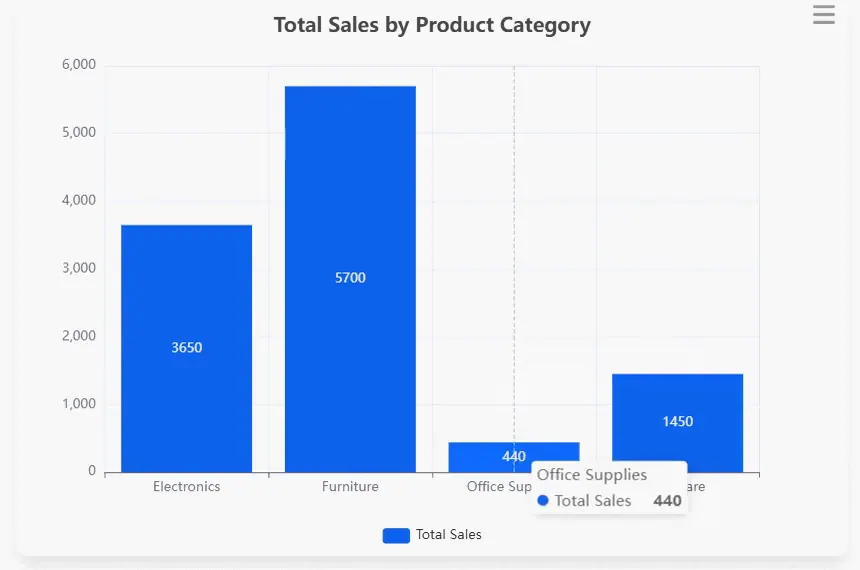
| Chart | Four bars labeled 3,650, 5,700, 440, and 1,450; displayed total 11,240 |
Period, currency, exclusions, and source reconciliation absent | Visual pass; KPI unverified |
| Formula audit | Detects a visible net-income residual of 53,250 |
Suggests “other deductions” without naming source evidence | Discrepancy pass; explanation fail |
| Workbook generation | Creates Raw_Data, KPI_Definitions, Pivot_Summary, and Dashboard sheets |
Several chart areas appear empty or incomplete | Artifact pass; presentation fail |
| File cleaning | Removes visible exact duplicates in an early pass | Dates remain mixed types and later steps are not proven to preserve prior constraints | Partial pass |
| File to dashboard | Filters, KPI cards, charts, and written insights | Metric grain and control totals are not independently captured | Artifact pass; metric approval pending |
2. Microsoft Copilot in Excel
Best for: Microsoft 365 teams that want assistance inside existing workbooks.
Workbook-native assistance is useful for users who need help exploring tables, drafting formulas, and making changes without leaving Excel. It is a natural choice when the workbook itself remains the main system of work. Check plan, tenant, and regional availability before designing a workflow around a specific feature.
3. ChatGPT with data analysis
Best for: Ad hoc file analysis, explanation, prototyping, and exploratory questions.
General AI is useful when an analyst wants to upload a file, ask a sequence of questions, and try several hypotheses quickly. It is less suitable as the sole operating process for a recurring report unless the team documents definitions, prompts, source files, and review checks.
4. Claude
Best for: Reading, summarising, and discussing complex documents or tables in a conversational workflow.
Claude can be useful for an analyst who needs to understand a long spreadsheet or combine table context with narrative documents. Treat any analysis as a draft until calculations and source definitions have been independently reviewed.
5. Gemini and Google Sheets AI workflows
Best for: Teams that already work in Google Workspace and need assistance near Sheets and Drive.
This category suits collaborative spreadsheet workflows that stay primarily in Google tools. It is worth testing when the team needs summaries or formula help in Sheets, rather than a separate reporting workspace.
6. Julius AI
Best for: Conversational analysis and data exploration with a technical notebook-style feel.
Julius AI is often considered by analysts who want to ask questions, generate charts, and inspect analytical work in a dedicated interface. It can suit exploratory analysis, especially when an analyst is comfortable reviewing the reasoning and outputs before sharing them.
7. Numerous.ai
Best for: Repetitive in-cell text classification, enrichment, and formula-adjacent work.
An in-grid AI tool is useful when the job is repeated across rows: categorising product descriptions, extracting text fields, or drafting short copy. It is not the same as a reporting workflow, so test costs and output consistency at the volume you expect.
8. Rows
Best for: Teams that want a modern spreadsheet with connected data and collaborative views.
Rows fits users who are willing to work in a new spreadsheet environment to combine data connections, calculations, and collaborative reporting. Compare it with Excel-native tools when the main decision is whether to keep the existing workbook as the operational surface.
9. Akkio
Best for: Predictive and no-code analytics use cases.
Use a predictive analytics platform when the question is about forecasting, scoring, or model-driven decisions rather than everyday spreadsheet formulas. Validate the business target, training data, and performance criteria before deploying a prediction in a business process.
10. Datawrapper
Best for: Clear, publication-quality charts and maps.
Datawrapper is chart-first rather than spreadsheet-first. It can be the right final-mile tool when data is already checked and the priority is a polished, shareable visual. It does not replace data preparation or variance analysis.
11. Ajelix
Best for: Formula, VBA, and spreadsheet-task assistance.
Formula and script assistants help when the bottleneck is constructing, explaining, or debugging spreadsheet logic. They are useful for users who will review and own the resulting workbook, rather than for teams seeking an end-to-end reporting layer.
12. Formula Bot
Best for: Translating a plain-English request into a starting formula or formula explanation.
Formula tools are practical for a narrow task: getting unstuck on syntax. They should not be assessed by the same standard as data analysis or BI products. Always test a generated formula against known values before filling it across a production table.
Evidence status and first test for all 12 tools
| Tool | Main operating surface | Evidence used in this article | First workflow to test |
|---|---|---|---|
| RowSpeak | File-based analysis and reporting workspace | Recorded repository runs plus visible failures | Dirty export to reconciled report/dashboard |
| Microsoft Copilot in Excel | Microsoft 365 workbook | Vendor documentation; not independently executed | Formula/edit task inside the delivery workbook |
| ChatGPT data analysis | General chat with uploaded files | Vendor documentation; not independently executed | Ad hoc analysis with saved calculations and artifact |
| Claude | General chat with documents/files | Vendor positioning; not independently executed | Long-table explanation with numeric spot checks |
| Gemini with Sheets | Google Workspace and Sheets | Vendor documentation; not independently executed | Collaborative Sheet formula and summary workflow |
| Julius AI | Dedicated conversational analysis | Vendor positioning; not independently executed | Exploratory analysis with inspectable calculations |
| Numerous.ai | In-grid spreadsheet enrichment | Vendor positioning; not independently executed | Repeated classification with consistency sample |
| Rows | Alternative collaborative spreadsheet | Vendor positioning; not independently executed | Connected-table workflow and handoff requirements |
| Akkio | Predictive/no-code analytics | Vendor positioning; not independently executed | Held-out prediction test with defined target |
| Datawrapper | Chart-first editor | Vendor positioning; not independently executed | Checked table to publication-ready chart |
| Ajelix | Formula/VBA spreadsheet assistance | Vendor positioning; not independently executed | Known formula and VBA debugging fixture |
| Formula Bot | Formula generation/explanation | Vendor positioning; not independently executed | Ten formulas with known expected outputs |
This table is not a ranking disguised as evidence. Only RowSpeak has hands-on visual evidence in this article. Run the same fixture yourself before turning any vendor-described capability into a procurement score.
Run a fair test with one business file
Before choosing a tool, use the same anonymized file with a known answer. Download Executive_Quickstart_Sample.xlsx. It contains eight nonblank records, one blank row, an exact duplicate ORD-001, mixed date representations, one blank status, and a legitimate negative profit value of -150 that must be surfaced rather than silently “fixed.” Exact de-duplication should leave seven nonblank records.
Ask each option to:
Profile this workbook before changing it. Return row and column counts, exact
duplicate groups, date representations, blank counts by field, and negative
profit rows. Then create a separate cleaned artifact that removes only exact
duplicates, preserves legitimate negative values, and lists every changed cell.
Reconcile the final nonblank row count to the expected seven unique records.
Score the result on accuracy, explainability, output quality, and the effort required to repeat it next month. Fail the run if the blank row becomes a record, -150 becomes zero, the missing status is invented, or a date is converted without declaring a convention. That test is more useful than an undifferentiated “best AI tool” ranking.
Use this minimum result sheet:
| Measure | How to record it |
|---|---|
| Import integrity | Expected rows vs imported rows; expected columns vs recognized columns |
| Numerical correctness | Two control totals and one grouped total compared with independent calculations |
| Defect detection | Seeded issues found, missed issues, and false positives |
| Evidence quality | Whether claims include fields, filters, periods, and underlying values |
| Repeatability | Same prompt on a renamed-column copy and on a second run |
| Artifact usability | Workbook, table, chart, report, or dashboard ready for reviewer handoff |
| Reviewer effort | Corrections and elapsed time to a usable result |
For scale testing, create 5 MB, 25 MB, and 50 MB versions from the same dataset. Do not merely record “upload succeeded.” Reconcile rows and totals after each run. If a vendor or plan does not support one size, report it as “not supported in this test configuration,” not as a model-quality failure.
A deeper category comparison
| Category and examples | Primary operating surface | Best deliverable | Multi-file context | Strongest review mechanism | Typical failure mode |
|---|---|---|---|---|---|
| Workbook-native assistant — Microsoft Copilot in Excel | Existing workbook | Edited workbook, formula, table, or chart | Usually centered on the workbook and connected Microsoft context | Visible cells, formulas, tables, and workbook review | Poorly structured ranges, hidden dependencies, or unsupported tenant/client configuration |
| Workspace-native assistant — Gemini in Sheets | Google Sheets and Workspace | Collaborative Sheet, formula, table, summary | Strongest when sources already live in Workspace | Cell history, comments, and Sheet sharing | Treating a Sheet-level answer as a complete reporting process |
| General AI analysis — ChatGPT or Claude | Conversation with uploaded files | Exploration, code, tables, summaries, downloadable artifacts | Useful for ad hoc combinations within product limits | Conversation plus generated code/artifacts | Definitions and steps are not preserved for the next reporting cycle |
| In-grid AI — Numerous.ai or formula assistants | Spreadsheet cells | Row-level enrichment or formulas | Limited by what is represented in the grid | Cell-by-cell inspection and formulas | Inconsistent classification at volume or hidden per-row cost |
| File-to-report — RowSpeak | Uploaded Excel, CSV, PDF, screenshot, or image table | Reviewable analysis, report, or dashboard | Designed for file packages and exported business data | Displayed analysis, exception review, downloadable/report outputs | Ambiguous mappings or business definitions still require an owner |
| Chart-first — Datawrapper | Visualization editor | Publication-ready chart or map | Assumes data preparation is largely complete | Visual preview, annotations, and source notes | Beautiful output built on an unchecked aggregation |
| BI platform | Governed model and connectors | Shared dashboard with refresh and access controls | Built for multiple live systems | Data model, lineage, refresh logs, permissions | High setup cost for a small, unstable export-driven process |
The matrix explains why a single 1–10 score is misleading. A formula assistant can beat a file-to-report tool on formula latency and still be the wrong choice for a monthly report built from three exports.
Three common selection paths
Path 1: The workbook is the deliverable
If an accounting or planning team must deliver a controlled Excel workbook, start with Excel-native assistance, formula tools, and a review process inside the workbook. The key question is not whether the AI can make a chart; it is whether the workbook owner can validate every formula and change.
Choose this path when the output is a model, template, or audited workbook. Do not force the team into a separate data-analysis platform simply because it has stronger chat features.
Path 2: The team has exports and needs a management report
If the work starts with CRM exports, transaction files, PDFs, or spreadsheets from several owners, the bottleneck is usually preparation and reporting rather than formula syntax. Start with a file-to-report workflow and test whether it can preserve metric definitions, surface exceptions, and produce a reviewable draft.
This is where RowSpeak is most relevant. It helps teams turn files into answers, reports, and dashboards, then refine the output when a reviewer finds a mapping or interpretation that needs correction.
Path 3: The business needs one governed dashboard for many users
If sales, finance, operations, and leadership all need the same KPI refreshed from operational systems, compare BI platforms and the data work required to support them. A general AI chat tool may accelerate exploration, but it will not create the governance, refresh policy, or access model by itself.
What not to compare as if it were the same thing
The phrase “AI tool for Excel” covers very different products. Keep these distinctions clear:
| Category | Good question to ask | Weak comparison method |
|---|---|---|
| Formula assistant | Does it generate a correct formula for my workbook? | Comparing it with a dashboard platform |
| General AI analysis | Can it explore and explain this file safely? | Assuming a chat answer is a monthly reporting process |
| Spreadsheet-native assistant | Can it help inside our existing Excel or Sheets workflow? | Ignoring workbook and tenant constraints |
| File-to-report workflow | Can it convert messy exports into a reviewable output? | Judging it only by in-cell editing |
| BI platform | Can it govern shared metrics across systems? | Expecting instant value from an undefined dashboard project |
Questions to ask during a vendor evaluation
Ask the vendor or internal owner to demonstrate the workflow using a safe version of your own data. Then ask:
- How are source columns mapped when a monthly export changes?
- Can the output separate verified calculations from narrative interpretation?
- What does a reviewer see when a result looks wrong?
- Can the team save a repeatable workflow or report structure?
- What privacy, access, and deployment options apply to the type of data in the file?
Do not accept a polished sample dashboard as evidence that the tool will handle your data. A valid evaluation ends with a report owner saying they would trust the output enough to review and improve it next month.
Ask one more uncomfortable question: what did the tool fail to do in this test? A credible evaluation log includes unsupported files, missed exceptions, timeouts, silent type coercion, wrong category merges, and corrections made after the first answer. Removing failed attempts makes a case study less useful and less trustworthy.
For current category details, consult first-party documentation such as Microsoft Copilot in Excel, Gemini in Google Sheets, and the ChatGPT file uploads FAQ. These pages document product behavior and limits; they do not provide an independent cross-tool benchmark.
Where RowSpeak fits
Use data analysis workflows when the job is a quick question about one clean table. Use Excel-native assistance when the workbook needs to remain the working surface. Use BI when governed definitions, many live systems, and broad access control are essential.
Use RowSpeak when the gap is between those choices: the team has real business files, needs analysis and a report or dashboard, and wants outputs that colleagues can review and correct without building a heavy BI project first.
Final checklist
Before you decide, confirm the tool handles your actual file type, your data-handling requirements, the output your manager expects, and the review process your team can sustain. Then test it on the next real export, not a polished demo dataset. If your target is a reviewable report or dashboard from business files, run the controlled fixture in the RowSpeak spreadsheet analysis workflow and retain the failed attempts beside the final output.