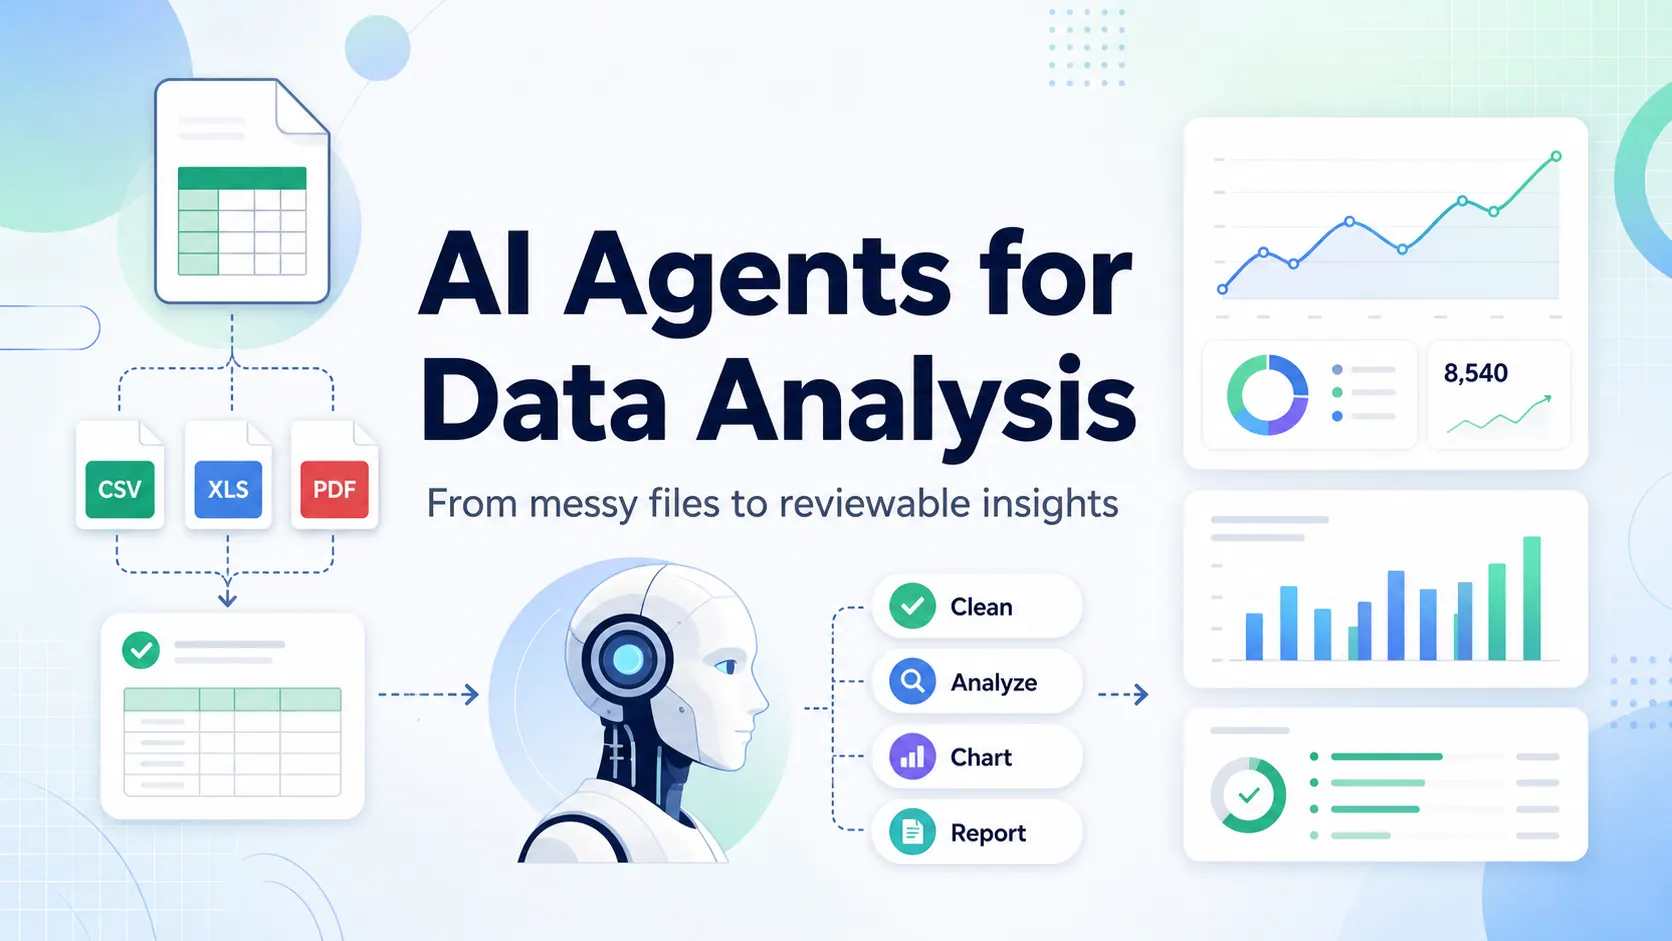
AI agents for data analysis are AI systems that can inspect data, choose an analysis path, run calculations or transformations, explain the result, and help produce reviewable outputs such as charts, summaries, dashboards, or reports.
That definition sounds simple. The hard part is making it useful for real work.
Most business data does not start in a clean warehouse table. It starts in Excel files, CSV exports, PDF statements, screenshots of tables, CRM downloads, ad platform exports, inventory reports, and workbooks that have been edited by five different people. A data analysis agent is only valuable if it can handle that mess without hiding the assumptions behind a polished answer.
This guide explains how AI agents for data analysis work, where they fit, how they compare with ChatGPT and BI tools, and how spreadsheet-heavy teams can use them without losing control of the numbers.
Key takeaways:
- A useful AI data analysis agent should inspect source files, check data quality, calculate metrics, create visuals, and preserve review steps.
- Spreadsheet-heavy teams need agents that work with Excel, CSV, PDF, screenshots, and exported business data, not only clean database tables.
- RowSpeak fits when the goal is to turn messy business files into reviewable answers, charts, reports, and dashboards without starting a full BI build.
What are AI agents for data analysis?
An AI data analysis agent is a software assistant that can move through multiple steps of an analytical workflow instead of only answering a single prompt.
A basic chatbot might respond to:
Summarize this sales table.
An agentic AI workflow should be able to do more:
- Read the uploaded file.
- Identify columns, metrics, dates, segments, and possible data quality issues.
- Ask a clarifying question if the business goal is ambiguous.
- Clean or transform the data when needed.
- Calculate the requested metrics.
- Find patterns, outliers, or drivers.
- Create charts or tables that support the answer.
- Explain what changed and why it matters.
- Let the user review, correct, and export the result.
That sequence is why the term "agent" matters. The value is not that the AI sounds smart. The value is that it can coordinate a workflow.
For business teams, the most useful agents are not abstract autonomous systems. They are practical assistants for recurring questions:
- Why did revenue change this week?
- Which customers or products drove margin movement?
- Which campaign had the worst cost per lead?
- Which SKUs are at risk of stockout?
- Which expense categories are over budget?
- What should go into the monthly management report?
- Can this messy export become a dashboard before the meeting?
If the agent cannot connect those questions to the actual file in front of the user, it is not yet a data analysis workflow. It is just a conversation about analysis.
Why this keyword matters now
People searching for "AI agents for data analysis" are usually not looking for another generic AI definition. They are trying to understand whether a new class of tools can replace or improve part of their current reporting process.
The search intent is mixed:
- Some users want a plain-English explanation of agentic AI for analytics.
- Some want a tool shortlist.
- Some want to know whether AI agents can analyze spreadsheets.
- Some are comparing agents with dashboards, BI tools, notebooks, and ChatGPT.
- Some are evaluating whether the workflow is safe enough for real business data.
That makes the topic commercially useful, but also easy to get wrong. A vague article about "autonomous AI" will not help a finance manager, RevOps analyst, ecommerce operator, or sales leader who still has a folder full of monthly Excel exports.
The stronger angle is practical: what can an AI data analysis agent actually do with the files teams already use?
What an AI data analysis agent should actually do
A useful agent should cover more than one step of the workflow. In practice, that means five core jobs.
1. Understand messy business files
Most analysis starts with imperfect inputs. A file may have merged headers, blank rows, inconsistent dates, hidden formulas, duplicate customer names, manually edited categories, or screenshots copied into a PDF.
An agent should help identify:
- What tables exist in the file.
- Which columns are likely measures, dates, dimensions, or identifiers.
- Where data quality problems may affect the result.
- Whether the file has enough information to answer the user's question.
- Which assumptions need human confirmation.
This is where spreadsheet-native tools have an advantage over generic chat. They can be designed around files, rows, columns, worksheets, extracted tables, and report outputs rather than treating everything as plain text.
2. Convert vague business questions into analysis steps
Most users do not start with a perfect analytical prompt. They ask questions like:
Why did sales drop last month?
A good agent should translate that into a concrete plan:
- Define the comparison period.
- Check total sales by month.
- Break the change down by region, product, customer, or channel.
- Look for missing data, returns, discounts, or volume changes.
- Create a chart that shows the main driver.
- Summarize the finding in business language.
That translation layer is the difference between "AI generated text" and AI-assisted analysis.
3. Produce outputs people can review
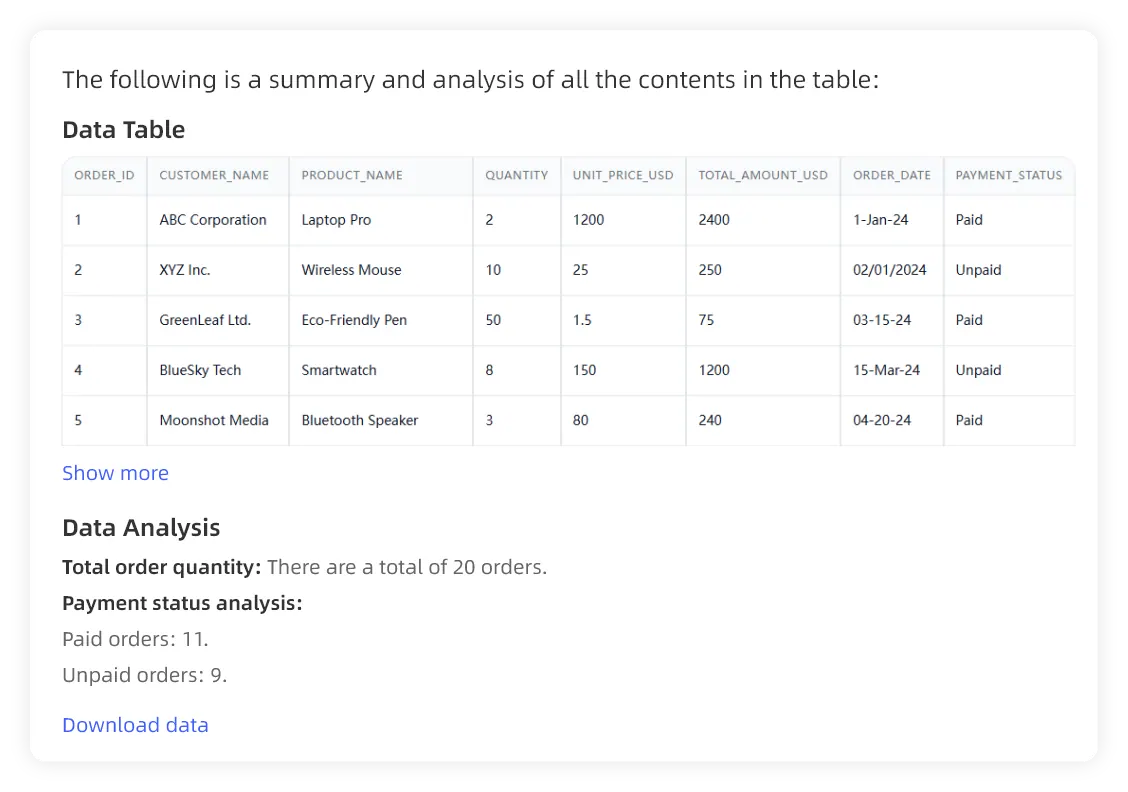
For low-risk work, a fast answer may be enough. For business reporting, the output needs to be reviewable.
The agent should show:
- Which file or table was used.
- Which fields were included.
- What calculation was performed.
- What assumptions were made.
- Which rows, segments, or periods drove the conclusion.
- What still needs human judgment.
This matters because a confident wrong answer is worse than a slow spreadsheet. If a result goes into a finance review, sales forecast, inventory decision, or client report, the team needs a way to check it.
For a deeper discussion, see A Good Excel AI Agent Should Produce Answers You Can Verify.
4. Generate charts and dashboard-style views
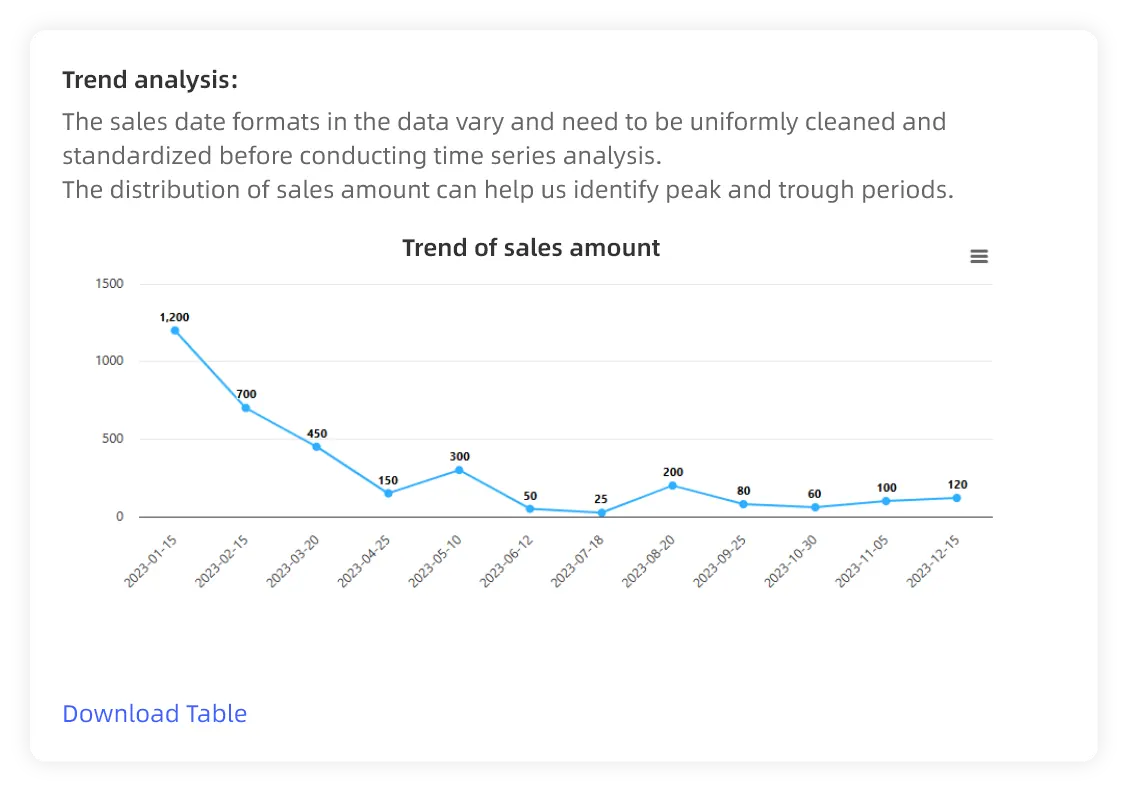
Many analysis requests end in a visual:
- Trend line for monthly revenue.
- Bar chart by region.
- Waterfall for budget variance.
- Heatmap for campaign performance.
- Scatter plot for price vs conversion.
- Inventory aging view.
An agent should not only describe the chart. It should help create a chart that matches the question, explain why that visual is appropriate, and let the user refine it.
If the output needs to become a report or dashboard, connect the workflow to a dedicated AI graph maker or Excel-to-dashboard workflow. The point is not decoration. The chart should make the answer easier to verify.
5. Support repeatable workflows
One-off analysis is useful. Repeatable analysis is where teams save time.
Common repeatable workflows include:
- Weekly sales reporting.
- Monthly management reporting.
- Campaign performance review.
- Budget variance analysis.
- Inventory replenishment review.
- Customer segmentation.
- Client reporting from CSV exports.
If your team repeats the same spreadsheet work every week or month, an AI agent should help preserve the workflow pattern: input files, checks, prompts, metrics, visuals, review steps, and final report structure.
That is where AI can sit between raw spreadsheet work and heavy BI. It does not need to replace every dashboard. It can remove the repetitive middle layer between exported files and decision-ready reporting.
AI agent vs ChatGPT vs BI tool vs spreadsheet automation
The phrase "AI agents for data analysis" often gets mixed with tools that solve different problems. Here is the practical distinction.
| Option | Best for | Where it struggles |
|---|---|---|
| ChatGPT or general AI chat | Explaining concepts, drafting formulas, summarizing small examples | File structure, repeatable reporting, auditability, large or messy business files |
| Spreadsheet formulas and macros | Stable calculations inside known workbooks | Changing file formats, natural-language questions, narrative reporting |
| BI tools | Governed dashboards, database-connected metrics, enterprise reporting | Ad hoc Excel/CSV/PDF work, fast one-off analysis, messy exported files |
| AI data analysis agents | Turning real files into analysis steps, charts, summaries, and reviewable reports | Still need human review, clear business context, and data governance |
This is why many spreadsheet-heavy teams do not need to choose between Excel and BI. They need a layer that helps with the messy work in between.
If the team already has a mature BI stack, an AI agent can help with ad hoc analysis and explanation. If the team lives in spreadsheets, an AI agent can help turn exported files into a structured report without forcing everyone into a full BI implementation first.
A practical workflow: from messy CSV to management report
Imagine a RevOps team has three files:
- A CRM opportunity export.
- A billing CSV.
- A sales target spreadsheet.
The VP of Sales asks:
Prepare a weekly sales performance summary. Compare actual bookings against target, highlight the top drivers by region and segment, flag any unusual changes, and create charts for the leadership meeting.
A useful AI data analysis agent should not jump straight to a polished paragraph. It should move through a workflow.
Step 1: Inspect the files
The agent checks the available columns:
- Deal ID.
- Customer.
- Region.
- Segment.
- Close date.
- Booking amount.
- Stage.
- Rep.
- Target.
- Prior period amount.
It should also flag obvious issues:
- Missing close dates.
- Duplicate deal IDs.
- Currency inconsistencies.
- Rows with no owner.
- Targets that do not match the reporting period.
Step 2: Confirm the reporting logic
If the user says "weekly sales performance," the agent may need to clarify:
- Should bookings use close date or invoice date?
- Should lost deals be excluded?
- Should targets be weekly or prorated from monthly targets?
- Should regions be grouped by sales territory or billing country?
This is not friction. This is control. A good agent knows when the business rule matters.
Step 3: Calculate and segment the result
The agent can then produce:
- Total bookings.
- Target attainment.
- Week-over-week change.
- Top regions by growth.
- Underperforming segments.
- Largest customer movements.
- Deals or rows that need review.
Step 4: Create the report view
The output might include:
- Executive summary.
- KPI table.
- Trend chart.
- Regional bar chart.
- Segment breakdown.
- Exception list.
- Suggested talking points.
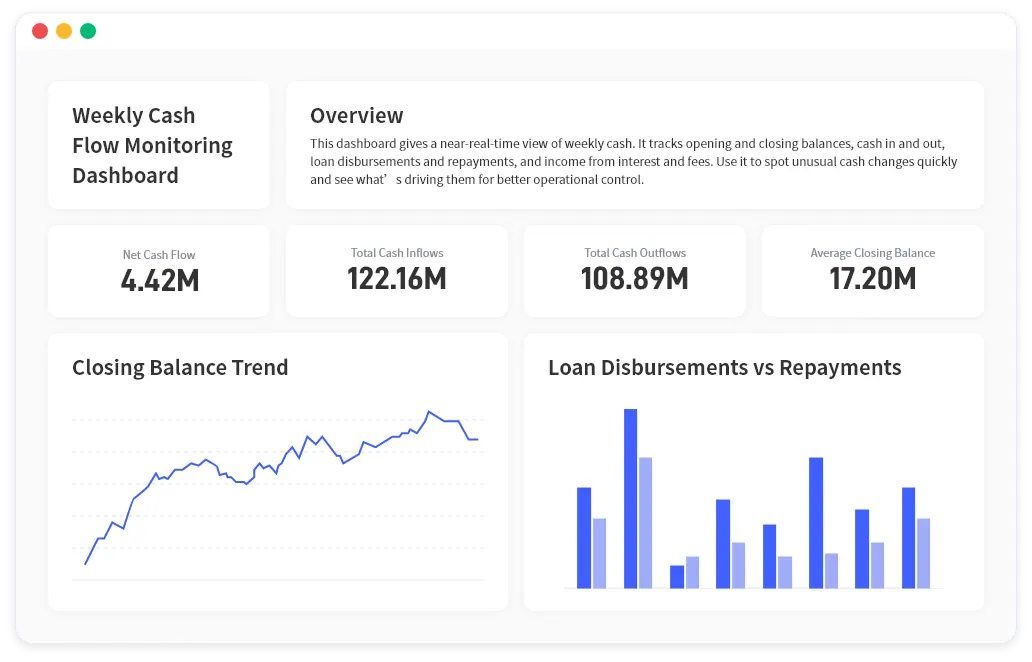
This is where a tool like RowSpeak's AI data analysis workflow fits naturally. The user can upload business files, ask questions in plain English, inspect the output, refine the analysis, and turn the result into charts or report-ready summaries.
For recurring reporting, connect the same pattern to weekly sales reporting or monthly management reporting.
How to use AI agents for data analysis
If you are trying this workflow for the first time, start with a narrow task. Do not ask an AI agent to "analyze the business." Give it a file, a role, a question, and a desired output.
Use this prompt structure:
You are helping with [business workflow].
Use the uploaded [file type] to answer [specific question].
Focus on [metrics, segments, or time period].
Before finalizing, check for [data quality issues].
Return [chart, table, executive summary, or report].
Flag anything that needs human review.
Example:
You are helping with the weekly ecommerce performance review.
Use the uploaded order export and ad spend CSV to explain why contribution margin changed last week.
Focus on channel, product category, refund rate, discount rate, and ad cost.
Before finalizing, check for missing order IDs and inconsistent date formats.
Return a short executive summary, a driver table, and two charts.
Flag anything that needs human review.
This prompt gives the agent enough context to work like an analyst, not a generic chatbot.
Where RowSpeak fits
RowSpeak is built for teams that work from real business files: Excel, CSV, PDF, screenshots, image-based tables, and exported data. The goal is not to replace every Excel workflow or every BI system. The goal is to make the work between raw files and usable analysis faster, clearer, and easier to review.
That makes RowSpeak a practical fit when:
- Your team receives messy files from multiple systems.
- Analysts spend too much time cleaning and reshaping spreadsheets.
- Managers need answers, charts, and report summaries without rebuilding formulas.
- The same weekly or monthly report is repeated with new exports.
- BI feels too heavy for the task, but pure chat feels too loose.
- Sensitive spreadsheet workflows require a more controlled process.
You can use RowSpeak to support:
- AI data analysis for uploaded files.
- AI business intelligence for reports, dashboards, and decision support.
- AI graph maker workflows for chart generation and visual explanation.
- Finance AI for variance analysis and reporting.
- Sales AI for revenue, pipeline, and customer analysis.
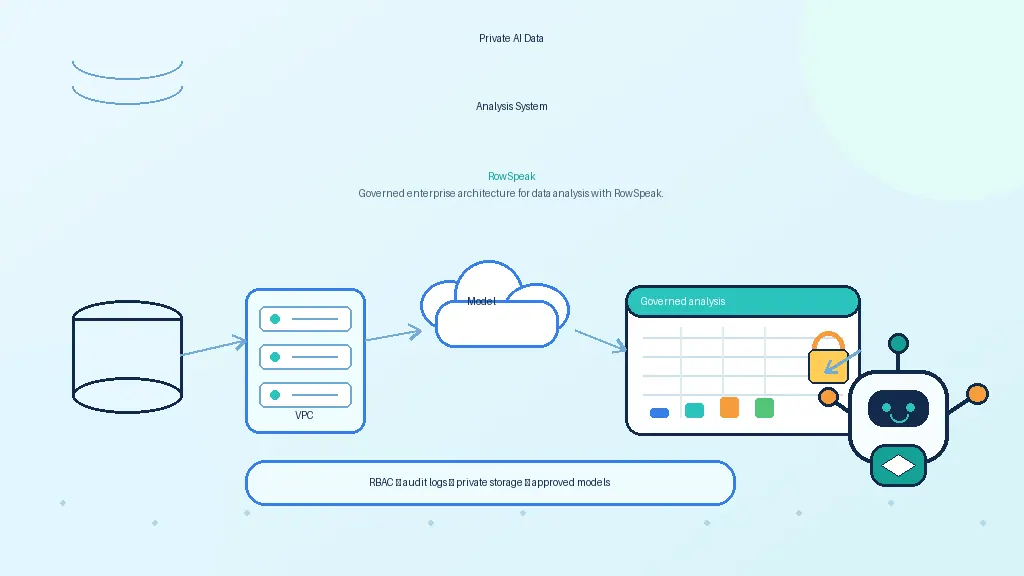
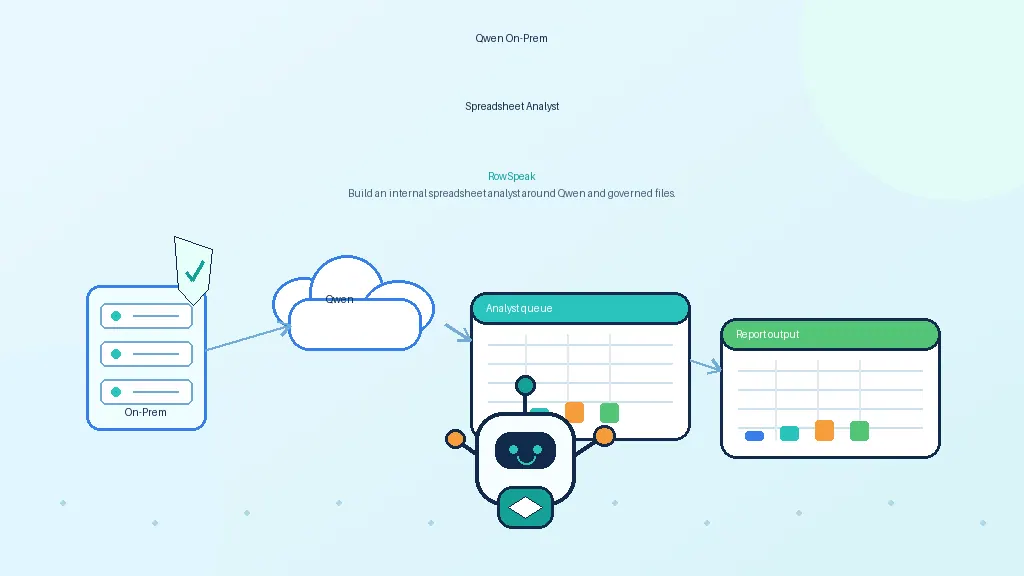
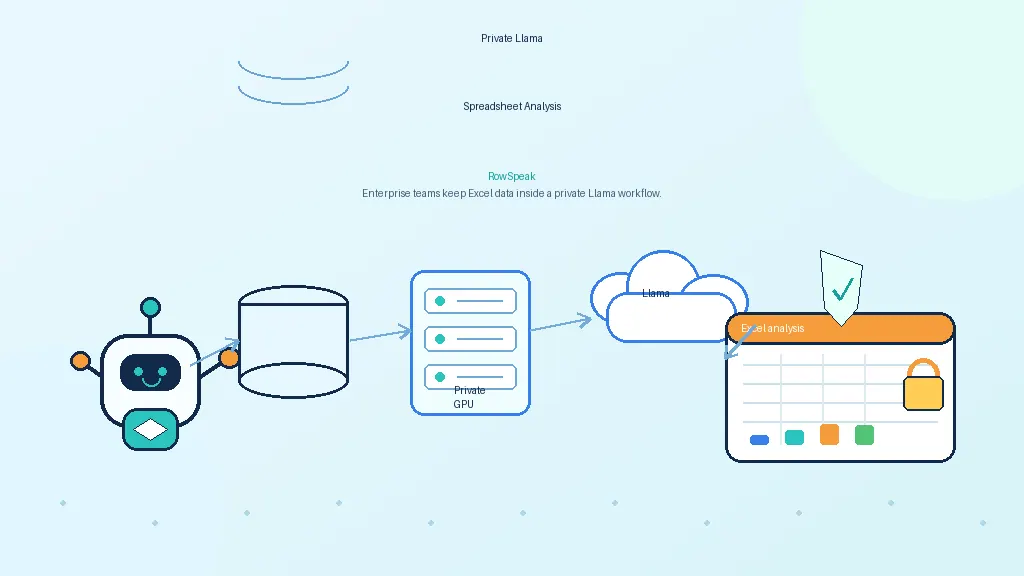
- Private deployment for teams that need more control over where spreadsheet workflows run.
The best use case is not "ask AI anything." It is "turn this business file into a result I can review and use."
What to check before trusting an AI data analysis agent
AI agents can accelerate analysis, but they should not remove judgment. Before using the output in a decision, check these points.
Data fit
Does the uploaded data actually contain the fields needed to answer the question? If the agent explains churn but the file has only monthly sales totals, the answer will be weak.
Calculation logic
Are definitions clear? Revenue, bookings, margin, active customer, churn, forecast, and conversion rate can mean different things in different teams.
Source traceability
Can you see which file, table, row group, or field supports the conclusion? If not, the answer is difficult to trust.
Visual accuracy
Does the chart use the right range, date period, labels, and units? A chart can look professional while still showing the wrong slice of data.
Human review
Does the final output separate facts, assumptions, and recommendations? That separation helps managers use the result without over-trusting it.
Which data analysis agent should you test first?
Start with the workflow, not the model name.
- If the data already lives in governed databases, test a BI or cloud analytics agent.
- If the work starts from Excel, CSV, PDF, screenshots, or exported business files, test a spreadsheet-first workflow.
- If the output needs a chart, dashboard, summary, or management report, test RowSpeak with a real file.
- If the task is mainly ad hoc reasoning, compare RowSpeak with a ChatGPT data analysis alternative workflow.
For a broader shortlist, use this guide together with Best AI Tools for Data Analysis in 2026.
Which AI agent is best for data analysis?
The best AI agent for data analysis depends on the work you need to finish.
If you are a data engineering team building governed pipelines, you may need an agent inside a cloud data platform or notebook workflow. If you are a business team working with spreadsheets, exports, and recurring reports, you need something closer to a file-based analysis workspace.
Use this decision rule:
- Choose a BI or cloud analytics agent when the data already lives in governed databases.
- Choose a notebook or coding agent when the analysis requires custom modeling and technical control.
- Choose a spreadsheet-first AI analysis tool when the work starts with Excel, CSV, PDF, or business exports.
- Choose RowSpeak when the output needs to become a reviewable answer, chart, report, or dashboard from real business files.
The best tool is the one that matches the starting point of the workflow. If your starting point is a messy spreadsheet, choose a tool designed for messy spreadsheets.
Common mistakes when using AI agents for data analysis
Mistake 1: Asking a vague question
"Analyze this data" usually produces a shallow answer. Ask for a specific business decision, comparison, metric, or output.
Mistake 2: Skipping data quality checks
The agent can only reason from the data it sees. Ask it to inspect duplicates, missing values, inconsistent dates, and unusual categories before summarizing.
Mistake 3: Treating the first answer as final
Good analysis is iterative. Ask follow-up questions:
Break this down by region.
Show the top five drivers.
Explain which rows created the largest variance.
Turn this into a chart for a management report.
Flag anything that may be caused by missing data.
Mistake 4: Over-automating decisions
AI agents should support decisions, not silently make them. Keep humans in the loop for definitions, approvals, and high-impact recommendations.
Mistake 5: Choosing a tool by buzzword instead of workflow
"Agentic" is not enough. The question is whether the tool can handle your files, your review process, and your reporting output.
FAQ: AI agents for data analysis
How can I use AI agents for data analysis?
Start with one specific workflow: sales reporting, budget variance, inventory review, campaign analysis, or customer segmentation. Upload the relevant file, ask a clear question, request data quality checks, and specify the output you need, such as a table, chart, executive summary, or report.
Can AI agents analyze Excel files?
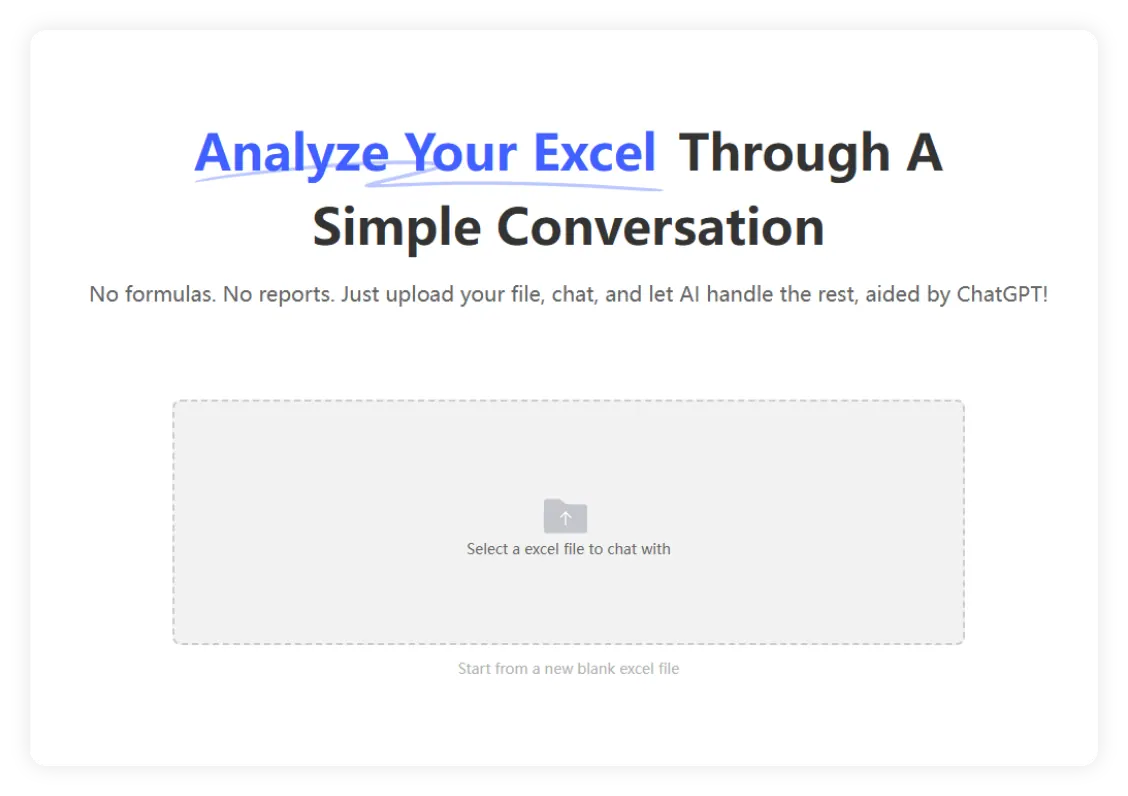
Yes, if the tool is designed for spreadsheet workflows. For business use, the agent should understand rows, columns, sheets, formulas, extracted tables, chart outputs, and file-specific context. A general chatbot may help explain spreadsheet concepts, but a spreadsheet-first tool is usually better for real Excel analysis.
Are AI agents better than dashboards?
Not always. Dashboards are better for stable metrics that many people need to monitor repeatedly. AI agents are useful for ad hoc questions, messy exported files, follow-up analysis, and report preparation. Many teams need both.
What is agentic AI for data analysis?
Agentic AI for data analysis means the AI can perform a sequence of analytical steps instead of only responding once. It may inspect the data, plan the analysis, run calculations, create visuals, explain the result, and ask for clarification when needed.
What should I ask an AI data analysis agent?
Ask for a business outcome. For example: "Use this sales export to explain why revenue changed month over month. Break the result down by region and product category, check for missing data, create a chart, and flag anything that needs review."
Final takeaway
AI agents for data analysis are not valuable because they use a new label. They are valuable when they help people move from messy business files to reviewable decisions faster.
For spreadsheet-heavy teams, the winning workflow is practical:
- Upload the real file.
- Ask a specific business question.
- Let the agent inspect, calculate, visualize, and explain.
- Review the assumptions.
- Turn the result into a report, dashboard, or next action.
If that is the workflow you need, try RowSpeak's AI data analysis tools with one messy Excel, CSV, PDF, or exported business file. The goal is not to make analysis feel magical. The goal is to make it usable, reviewable, and fast enough for the way teams actually work.