The best AI spreadsheet prompt is not “analyse this file.” It tells the tool what file it is reading, what business question matters, which time period to use, what output to create, and what a human must verify.
The 25 tasks below are designed for finance, sales, and operations teams working with real exports. Use anonymized data when appropriate, and check the result before it becomes a report, forecast, or decision. A recorded prompt/result pair and a downloadable dirty-data fixture show how to test the prompts instead of assuming that more detail automatically produces a correct answer.
Key takeaways:
- Build every prompt from six fields: source file and row grain, reporting period, metric definition, exclusions, required output, and acceptance checks. If one is missing, the answer is harder to reproduce.
- Require an exception table before recommendations. For duplicates, label mapping, anomaly detection, forecasts, and causal explanations, ask the tool to preserve source rows and state uncertainty instead of modifying data silently.
- Add at least two control totals and five seeded edge cases to a safe test file. A useful prompt should match the totals, find the known defects, and disclose anything it could not interpret.
- Save the prompt, source version, output, reviewer corrections, and approval date. That turns a one-off answer into an AI reporting workflow another analyst can audit next month.
- A recorded cleaning sequence improved duplicate handling but left mixed date types after the first pass. Prompt quality must be judged across every requested constraint, not by one successful transformation.
Before you run any prompt
Check that the file has a header row, a known reporting period, and a clear grain. A table of monthly totals needs a different question than an order-level export. If a column is ambiguous, rename it before analysis rather than hoping AI will infer its meaning.
Use this base instruction when needed:
Use only the fields in this file. State the period and metric definition used.
Show the calculation or grouped values behind each conclusion. Do not infer a
cause that is not supported by the data. List records or categories that need
human review before this output is shared.
Make each prompt testable
For recurring work, add five details to every request:
| Prompt detail | Example |
|---|---|
| File and grain | orders_export.xlsx, one row per order |
| Period | January through June 2026 |
| Metric definition | Net revenue after refunds, excluding cancelled orders |
| Output format | Sorted table plus five report bullets |
| Review rule | List exceptions before making a recommendation |
These details turn a vague request into an analysis that another person can reproduce. They also make it easier to identify whether a bad result came from a source file, a metric definition, or an interpretation.
Add an output contract
For business analysis, append a compact output contract to the prompt:
Return five sections in this order:
1. Input summary: file, sheet, row count, date range, and fields used.
2. Data-quality exceptions: source row, issue, and proposed next check.
3. Calculations: formula or grouping, filters, and control totals.
4. Findings: verified facts separated from hypotheses.
5. Reviewer sign-off: unresolved questions and values to reconcile.
The structure prevents a polished narrative from appearing before the input and calculation have been disclosed.
A recorded prompt/result pair, with the missing review step
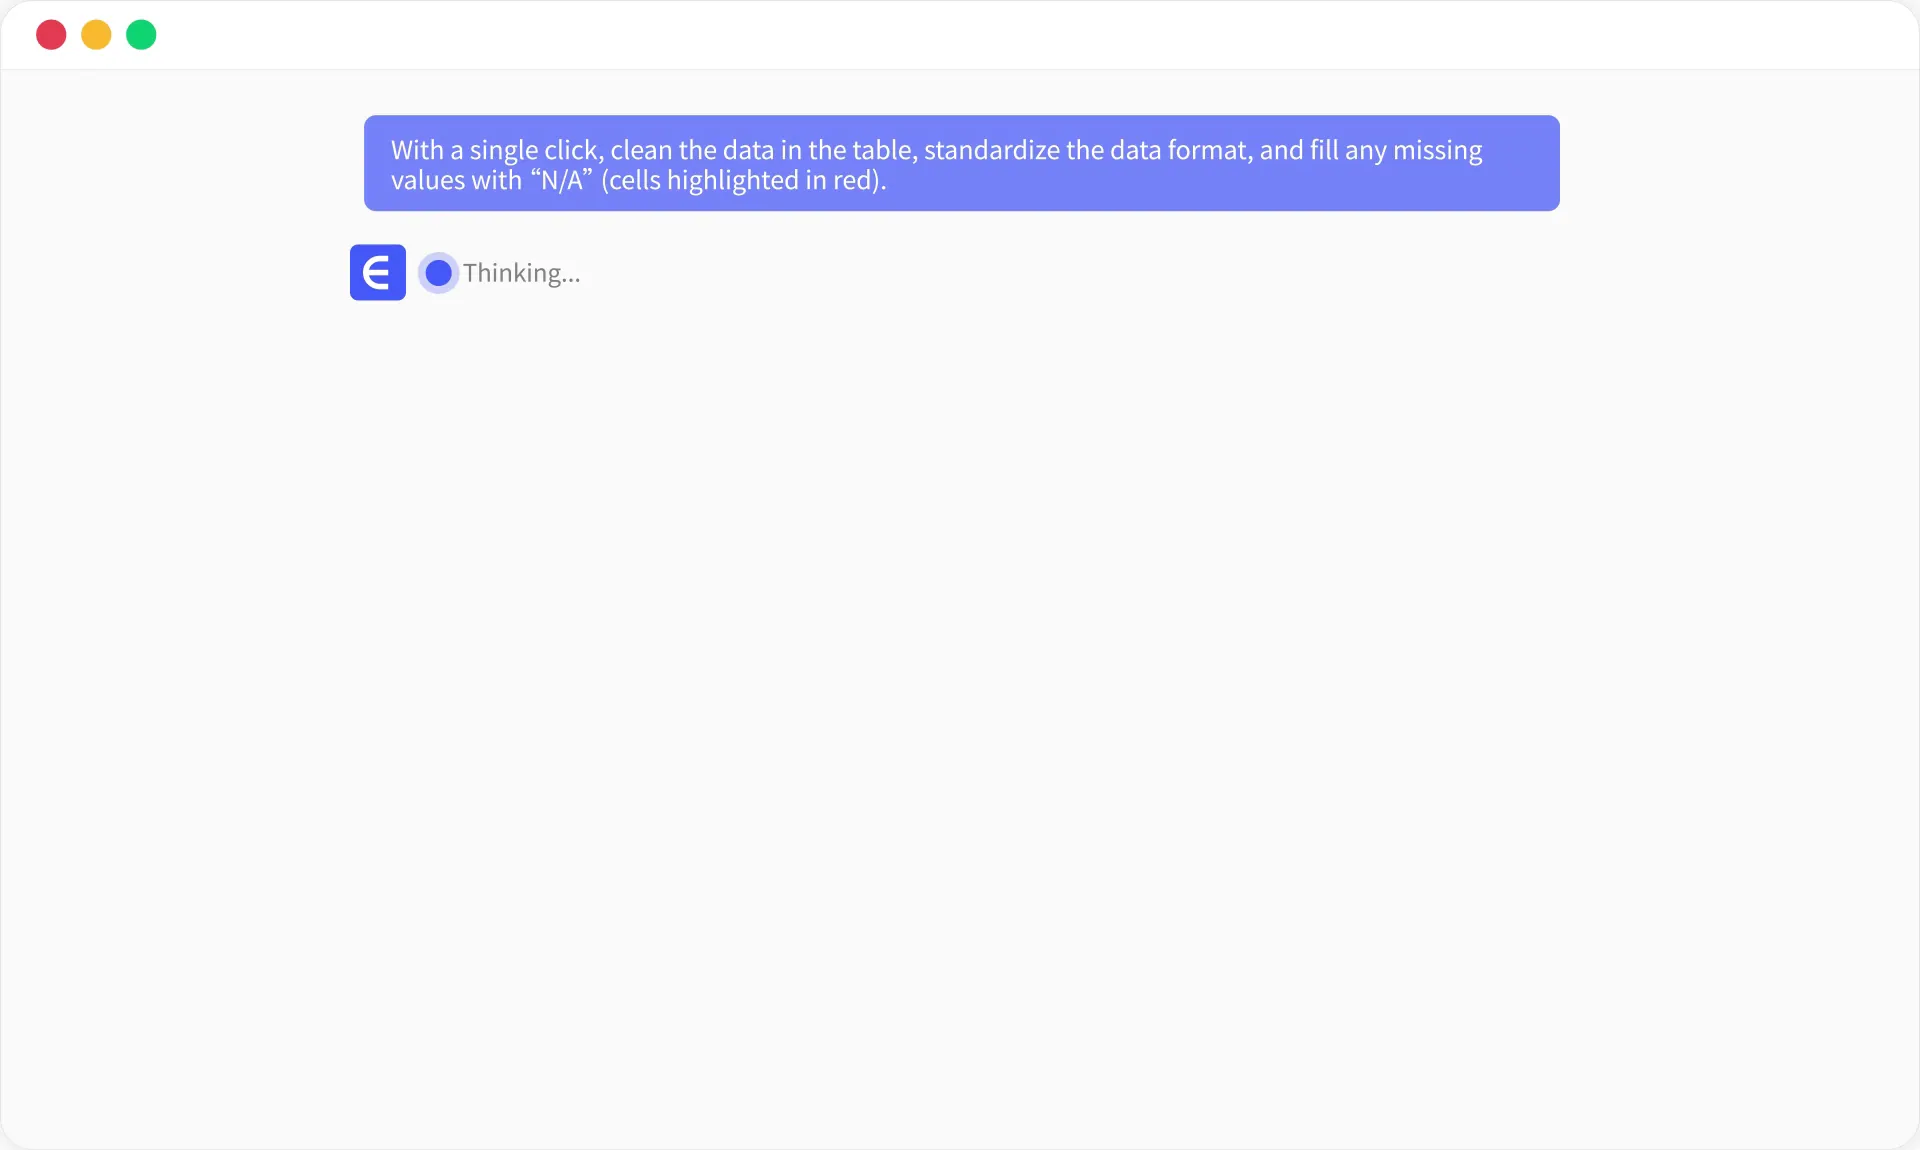
In this RowSpeak demonstration, Registry.xlsx was submitted with a request to standardize formats and replace missing values with N/A.
The returned response lists the transformations and provides a cleaned workbook.
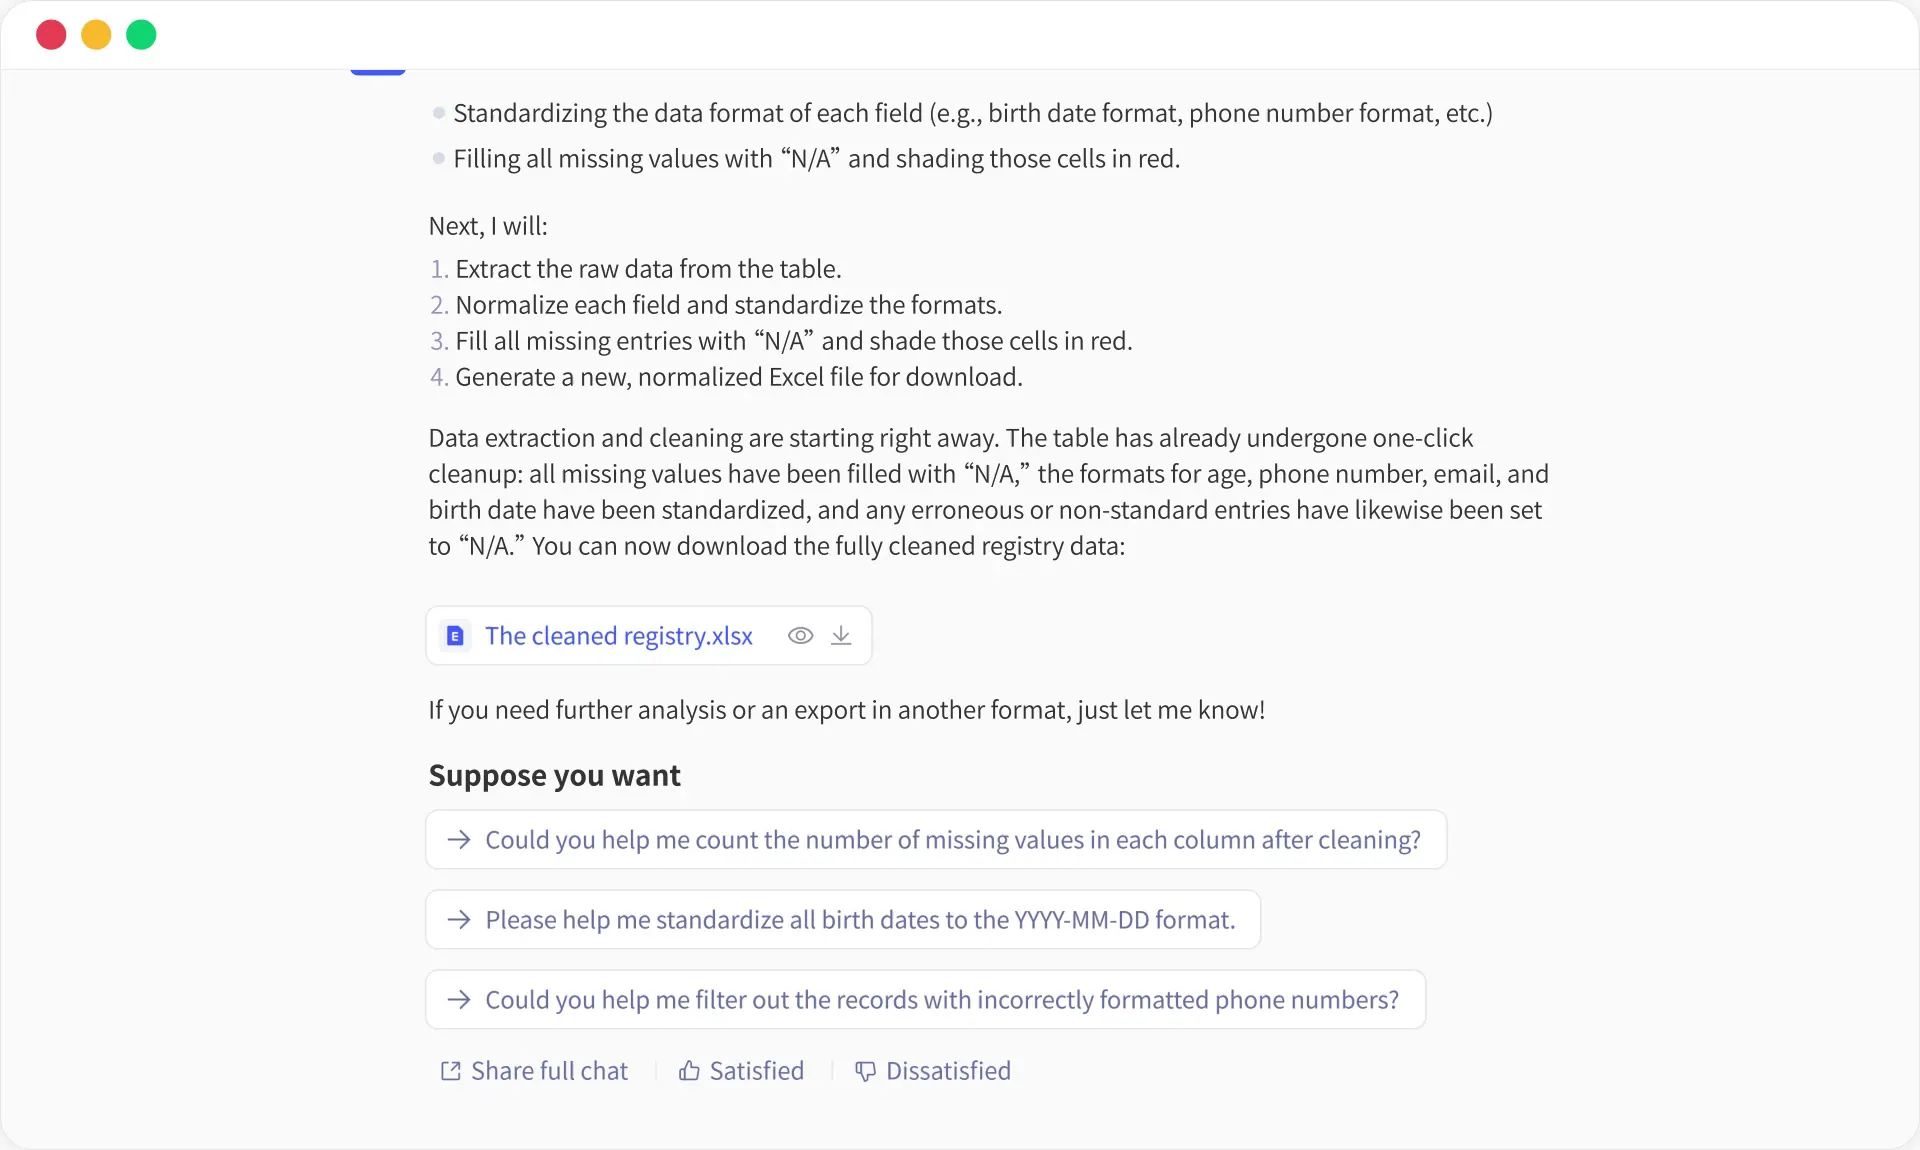
The prompt is convenient but under-specified for production work. It does not define the date locale, valid phone-number patterns, whether blank and not-applicable are distinct, or which original columns must remain unchanged. A stronger follow-up would require a mapping table, before/after null counts, rejected values, row-count reconciliation, and a sample of changed cells. The screenshot shows a working interaction; the critique shows how to make it reviewable.
A controlled prompt test with known answers
Download Sales_Data_Cleaning_Test.xlsx. The workbook is small enough to inspect manually and contains defects that expose vague prompts quickly:
- eight nonblank source records plus one blank row;
- two exact duplicate pairs for order IDs
1001and1002; - dates represented as dotted text, slash-formatted text, and date-like values;
- missing prices for
1003and1005; - missing statuses for
1003and1006; - inconsistent customer-name casing.
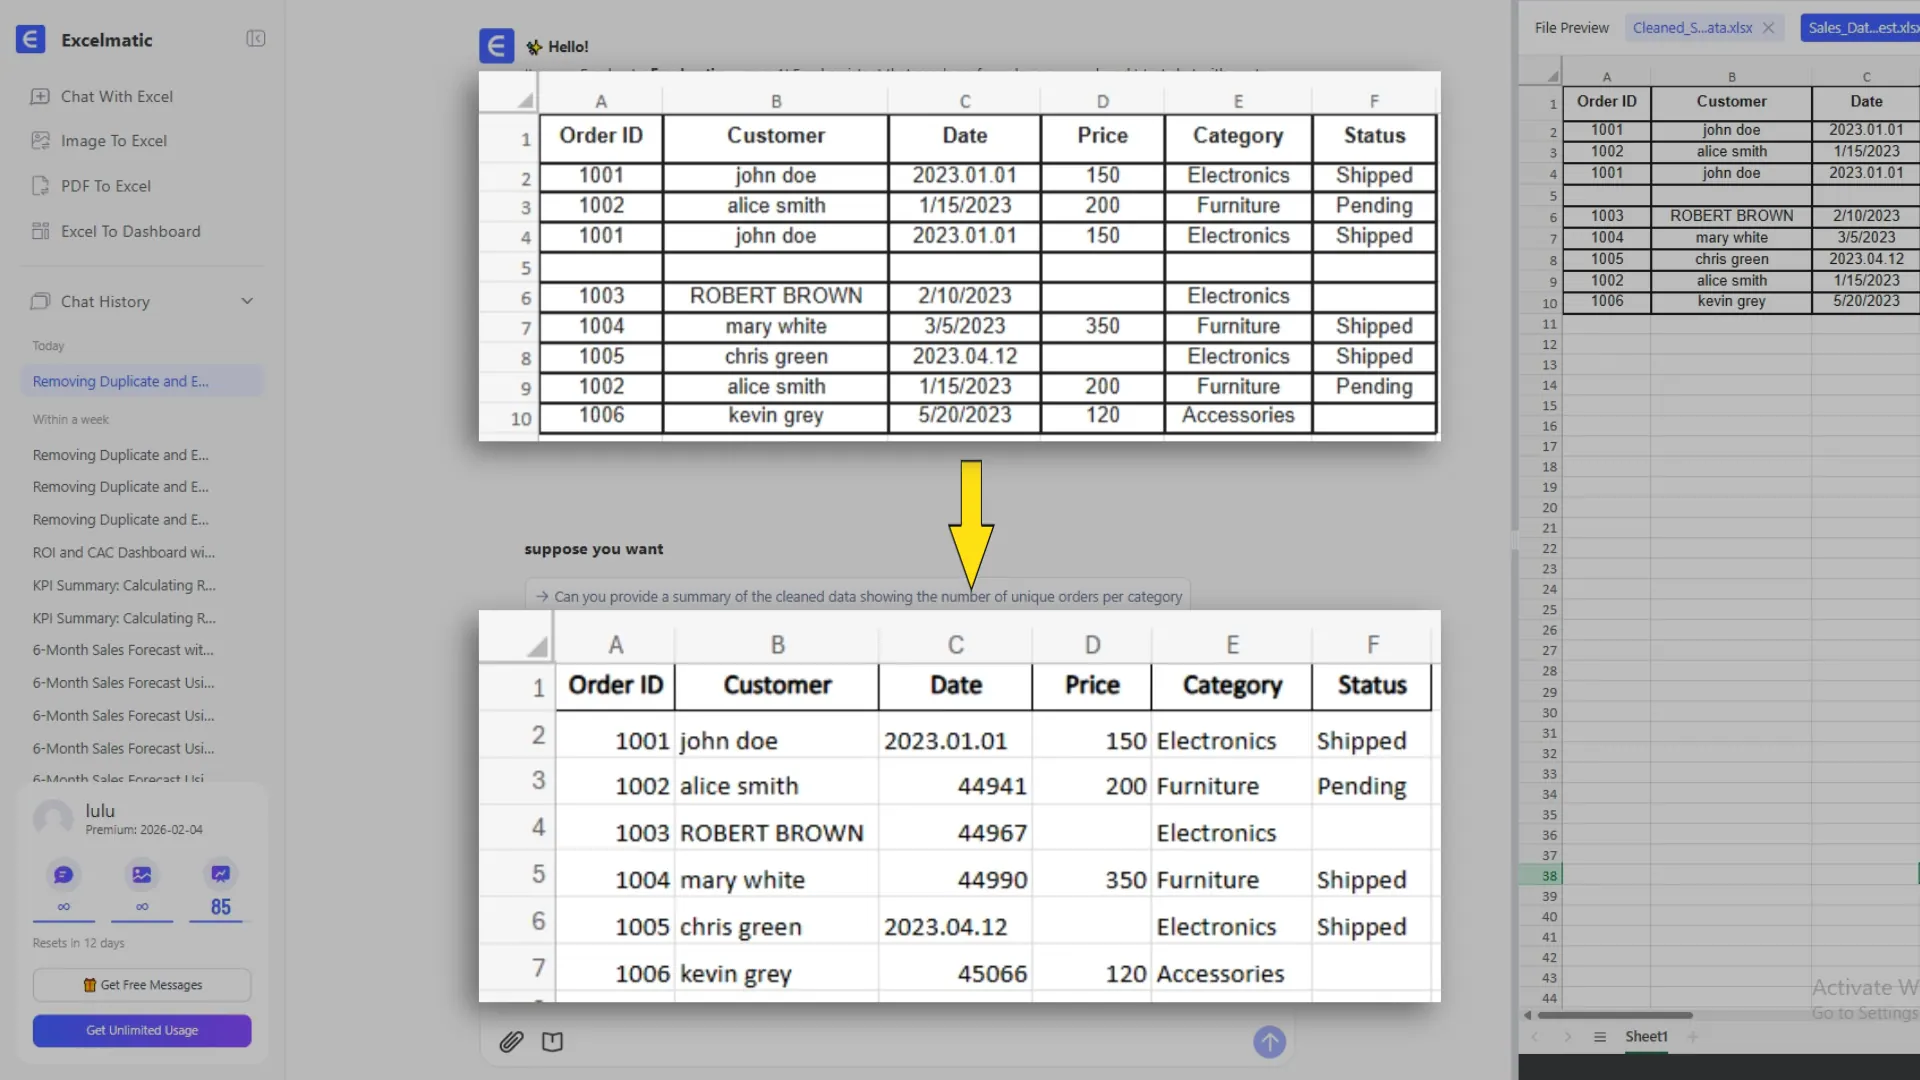
The recorded sequence below shows why the expected-answer sheet matters. After one cleaning pass, the visible table falls from eight nonblank rows to six, which is consistent with removing one row from each exact duplicate pair. But the date column still mixes text and Excel serial values.
Run tasks 1–5 below against the fixture and capture this ledger:
| Test | Expected result | Failure to record |
|---|---|---|
| Profile rows | Eight nonblank records; one blank row | Blank row counted as a transaction |
| Find duplicates | Two exact duplicate groups; six unique rows after exact de-duplication | Deletes records only because an ID matches |
| Check missing values | Two missing prices and two missing statuses | Converts blank price to zero or invents a status |
| Standardize dates | One declared date convention and one consistent stored type | Display looks consistent but cells retain mixed types |
| Standardize names | One approved casing rule with original values traceable | Rewrites customer identities without a change log |
This is not a published accuracy score for RowSpeak or any competitor. It is a reproducible acceptance test. Publish the misses, false positives, and unresolved values beside the successful output.
The 10-second clip shows the recorded prompt-to-artifact interaction. It is an edited workflow demonstration, not a processing-time measurement.
Use an analysis log for high-stakes work
When a prompt informs a finance or operational decision, save a compact analysis log with the source file name, report period, prompt, date run, reviewer, and changes made after review. The log does not need to be complicated. Its purpose is to prevent a later reader from seeing a polished conclusion without knowing what data and assumptions produced it.
For example, if an inventory report excludes discontinued SKUs, record that exclusion. If a sales report changes the definition of “qualified pipeline,” record the effective date. The business value is not bureaucracy; it is making comparisons honest over time.
Data quality tasks
1. Find missing required fields
Prompt: List records missing Order Date, Customer ID, Region, or Net Revenue. Group the omissions by source file and count them.
Review: Confirm those fields are truly required for the report.
2. Detect duplicate records
Prompt: Identify possible duplicate orders using Order ID, Customer ID, order date, and amount. Do not delete anything; return a review table.
Review: Duplicate-looking orders can be legitimate split shipments or corrections.
3. Standardize inconsistent labels
Prompt: Show distinct values in the Region and Channel columns. Suggest a mapping for spelling, case, and abbreviation differences, but keep an unmapped list.
Review: Approve the mapping before aggregating a report.
4. Check date coverage
Prompt: Summarize record counts by week. Flag missing dates, partial weeks, and periods outside the stated reporting range.
Review: Partial periods can make a trend look like a decline.
5. Find suspicious numeric values
Prompt: Flag negative quantities, zero prices, unusually large discounts, and values that cannot be parsed as numbers. Return the source rows.
Review: Decide whether an apparent outlier is a real business event.
Data-quality corner cases to include
- a legitimate split shipment that looks like a duplicate;
03/04/2026without a declared locale;- a subtotal row inside transaction data;
0, blank,N/A, andnot applicableused with different meanings;- a customer ID stored once as text and once as a number;
- an accented or non-Latin category label that should not be normalized away.
If the prompt cannot preserve those distinctions, stop before aggregating.
Finance tasks
6. Compare actuals with budget
Prompt: Compare actual operating expense with budget by account for the current month. Show dollar variance, variance percentage, and the five largest absolute variances.
7. Explain revenue movement
Prompt: Compare net revenue with the previous period by region and channel. Show the components of the largest movements without claiming a cause not present in the file.
8. Review refund rate
Prompt: Calculate refund rate by product category and month. Flag categories where refund rate increased materially from the prior period.
9. Review gross margin
Prompt: Calculate gross margin by product family using revenue and cost fields. Identify low-margin groups and show the contributing values.
10. Scan for unusual transactions
Prompt: List transactions that differ materially from the usual amount for the same customer or product category. Treat the result as a review queue, not fraud confirmation.
For finance prompts, specify how to handle a zero denominator, negative budget, missing prior period, mixed currency, and late adjustment. “Variance percentage” is undefined or misleading in several of those cases; require a dollar variance and an exception label instead of forcing a percentage.
Sales and marketing tasks
11. Build a pipeline summary
Prompt: Summarize qualified pipeline by stage, owner, and source. Show deal count, value, and the change from the prior snapshot.
12. Find stale deals
Prompt: Flag open deals with no activity in 14 days. Group them by owner and stage, and exclude deals marked closed.
13. Compare channel performance
Prompt: Compare leads, opportunities, spend, and closed revenue by acquisition channel. Show which fields are missing before calculating return metrics.
14. Review conversion rates
Prompt: Calculate stage-to-stage conversion by month. Identify the largest change and list the underlying count, not only the percentage.
15. Find revenue concentration
Prompt: Show the share of revenue from the top customers and flag concentration risk using thresholds supplied in the file or report instructions.
For sales prompts, preserve snapshot dates. A pipeline export is not a transaction ledger: the same deal can appear in several weekly snapshots without being a duplicate. Ask the tool to compare stable deal IDs within each snapshot before calculating movement.
Operations and inventory tasks
16. Identify low-stock risk
Prompt: Compare on-hand stock with average weekly demand. List products where current stock may not cover the stated lead time.
17. Review inventory movement
Prompt: Summarize units received, sold, returned, and on hand by SKU. Flag records where the inventory movement does not reconcile.
18. Compare supplier performance
Prompt: Compare supplier lead time, late delivery count, defect count, and purchase value. Show the sample size for each supplier.
19. Detect return patterns
Prompt: Group returns by product, reason, region, and month. Identify increases that should be reviewed by operations.
20. Forecast with explicit assumptions
Prompt: Using monthly demand history, create a simple baseline forecast for the next three months. State the method, assumptions, missing periods, and uncertainty limits.
For operations prompts, include stockouts, discontinued SKUs, supplier minimum-order quantities, lead-time units, and returns. A zero-sales week during a stockout is censored demand, not evidence that demand disappeared.
Management reporting tasks
21. Draft a KPI summary
Prompt: Write a five-bullet executive summary of the validated KPI table. Include current value, period comparison, and open questions. Avoid unsupported causal claims.
22. Suggest a chart set
Prompt: Recommend no more than four charts for this management report. For each, state the business question, fields, grouping, and review check.
23. Produce an exception log
Prompt: Create an exception log with issue type, source row, likely owner, and recommended next check. Do not assign blame.
24. Prepare a meeting agenda
Prompt: Turn the validated findings into a 30-minute review agenda with decisions required, owners, and supporting tables or charts.
25. Compare report versions
Prompt: Compare this month’s report table with last month’s. List changed KPI definitions, new categories, missing sections, and movements that require explanation.
Failure patterns to record in the analysis log
Do not save only the final successful answer. Record these outcomes when they occur:
| Failure pattern | Why it matters | Correct next action |
|---|---|---|
| Tool uses the wrong sheet | Correct-looking answer from the wrong data | Require sheet name and input summary |
| Percentage is averaged across rows | Gives small groups disproportionate weight | Recompute from total numerator and denominator |
| Missing values are converted to zero | Creates false activity or performance | Preserve missingness and document imputation |
| Narrative invents a driver | Turns correlation into an unsupported cause | Reclassify as a hypothesis and list required evidence |
| Second run changes category mapping | Breaks recurring comparability | Save and approve a mapping table |
| Output omits failed rows | Hides the scope of parsing errors | Require rejected-row count and downloadable exception table |
This failure log is often more useful than another “perfect prompt” because it tells the next analyst what to verify first.
Turn prompts into a repeatable workflow
These prompts become more valuable when the same file checks, metric definitions, and output sections repeat every month. RowSpeak can help teams use an Excel AI workflow to move from business files to answers, reports, and dashboards without treating every reporting cycle as a new blank page.
For finance, payroll, employee, or other sensitive data, use anonymized examples for experimentation and evaluate private deployment when controlled data boundaries are required.
The final step is always review. A prompt can accelerate analysis, but the person who owns the report must approve the definitions, exceptions, and action list before it is shared.
Start with the downloadable fixture and run the first five prompts in the RowSpeak Excel AI workflow. Save the missed defects and reviewer corrections alongside the final result so the next reporting cycle begins with evidence rather than another blank prompt.