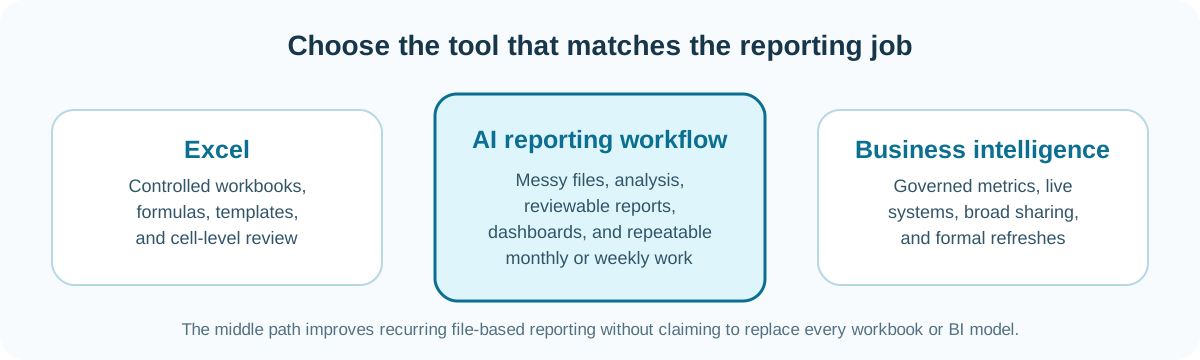
Excel is not obsolete, AI is not a reporting system by itself, and BI is not the answer to every recurring export. The useful question is: what does this reporting job need?
Some work needs precise workbook control. Some work needs a fast explanation from a collection of files. Some work needs governed definitions, live data models, and broad access controls. Treating these as the same problem leads to either manual spreadsheet overload or an unnecessarily large BI project.
This guide helps you choose a practical path for common business reporting tasks. It includes recorded RowSpeak outputs and a downloadable control workbook, while keeping competitor performance explicitly untested where the same workflow was not executed.
Key takeaways:
- Keep Excel when the workbook is the controlled deliverable and reviewers need cell-level formulas, scenarios, and approvals; add AI only where its proposed changes can be inspected.
- Use a file-based AI workflow when two or more recurring exports create most of the cleanup, reconciliation, charting, and narrative work—but keep control totals and KPI definitions outside the AI prompt.
- Move a stable metric into BI when it needs scheduled refresh, one governed definition, lineage, role-based access, and broad distribution. File size alone is not the deciding factor.
- Many teams should use all three: Excel for controlled models, RowSpeak for messy-file analysis and report drafting, and BI for mature shared metrics. The boundary should follow ownership and governance, not product hype.
- In the recorded evidence, RowSpeak produced formulas, a dashboard, and a four-sheet workbook, but the formula output lacked source recalculation and several generated chart areas remained incomplete. “Created” is not the same status as “approved.”
The decision criteria
Before choosing a tool, rate the workflow on four dimensions.
| Question | Why it matters |
|---|---|
| Does the work start with one workbook or several messy exports? | More files and formats increase preparation work |
| Is the output a one-time answer or a recurring report? | Repeating work needs stable definitions and steps |
| Must many teams use the same governed metric? | Shared definitions are a BI strength |
| Does a manager need a report before the next data-model project is complete? | A file-to-report workflow may be the right middle path |
Evidence standard used in this comparison
The matrix below compares workflow design, not model intelligence. It is based on observable product surfaces and the controls a reviewer can use. It does not present a timed 50 MB benchmark because Excel-native assistance, file-upload analysis, and BI refresh pipelines use different data paths; a fair performance test would require the same source data, account tier, network, acceptance checks, and repeated runs.
For your own evaluation, record imported rows, control totals, exception recall, reviewer corrections, time to first usable output, and repeatability after a schema change. A result that is fast but cannot be reconciled should fail.
Download the comparison workbook and establish control totals
Download BusinessMetrics.xlsx. It contains 30 data rows and 12 fields covering quarter, month, product, region, ad spend, sales, revenue, expenses, score, hours, customers, and profit margin.
Before submitting it to any AI, Excel workflow, or BI import, record these full-file controls:
| Control | Expected value |
|---|---|
| Data rows | 30 |
| Columns | 12 |
| Ad Spend total | 221,800 |
| Sales total | 69,100 |
| Revenue total | 3,455,000 |
| Expenses total | 1,978,000 |
| Customers total | 5,670 |
Then create a renamed-column copy (Revenue to Net Revenue) and a second copy with one new region. A repeatable workflow must either preserve an approved mapping or stop for review. Silently changing the measure is a failure even when the resulting dashboard looks reasonable.
When Excel is the right tool
Excel is still the best place for many jobs:
- audited financial models with visible formulas;
- controlled input templates used by a small team;
- detailed what-if analysis owned by an analyst;
- scenario models where users inspect individual cells;
- final workbook deliverables required by a customer or regulator.
AI can assist these workflows by explaining formulas, suggesting a calculation, or flagging possible errors. But the workbook should remain the system of record when the team needs cell-level control and an established review process.
The recorded formula-agent output below shows the useful and limited version of that assistance: several SUMIFS candidates, calculated values, and explanations are visible, but the source range and an independent Excel recalculation are not.
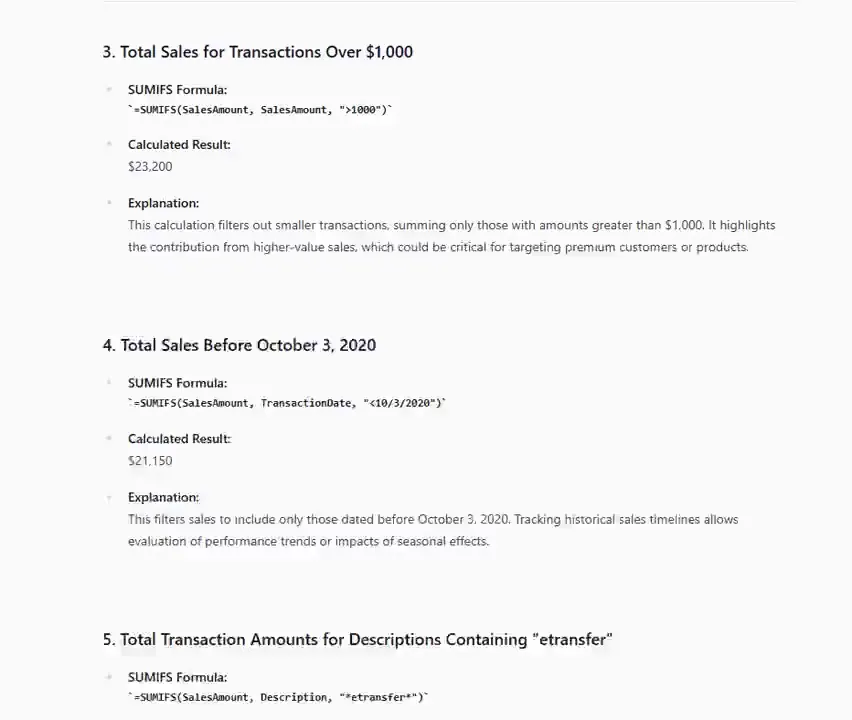
Watch for hidden sheets, named ranges, external links, cached formula values, macros, and manual overrides. An assistant may explain the visible formula correctly while missing a dependency that determines the official number.
When AI adds the most value
AI is most useful when the bottleneck is not a single formula. It is the work around the formula: combining exports, finding inconsistent labels, asking follow-up questions, choosing a chart, explaining a variance, and turning the result into a report.
For example, a finance manager may receive an actuals workbook, budget workbook, and supplier PDF each month. Building a governed data warehouse for the first report may be excessive. Manually copying values every month is also wasteful. An AI-assisted data analysis workflow can help move from those files to a checked report while the team decides whether a larger BI investment is justified.
The image below is a real RowSpeak output example for budget-versus-actual analysis. It presents KPI cards, a ratio chart, a trend, and sources of variance in one reviewable view.
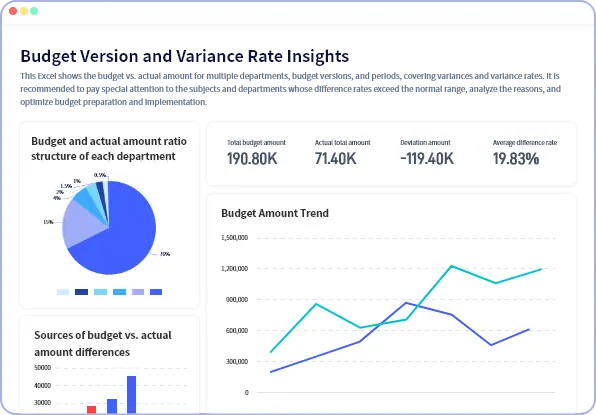
The screenshot demonstrates the reporting surface, not the correctness of the model behind it. A finance reviewer still needs to confirm the budget version, actuals cutoff, sign convention, currency, account mapping, and why the headline cards show a large negative deviation alongside a positive average difference rate.
What the recorded evidence actually establishes
| Tool surface | Observed artifact in this repository | What it establishes | What remains unproven |
|---|---|---|---|
| Formula assistance | SUMIFS formulas, displayed results, and explanations |
A natural-language-to-formula workflow exists | Correct source ranges, date semantics, and workbook recalculation |
| RowSpeak file to dashboard | KPI cards, filters, charts, and written findings | A file can become a review surface rather than only a chat answer | KPI definitions, source totals, and behavior on the next-period schema |
| RowSpeak workbook generation | Four-sheet .xlsx with a dashboard |
A structured workbook artifact can be produced | Several chart areas appear empty or incomplete and require repair |
| BI product surface | Site product image and category-level documentation | Illustrates the governed-dashboard destination | No refresh, permission, lineage, or performance test was executed for this article |
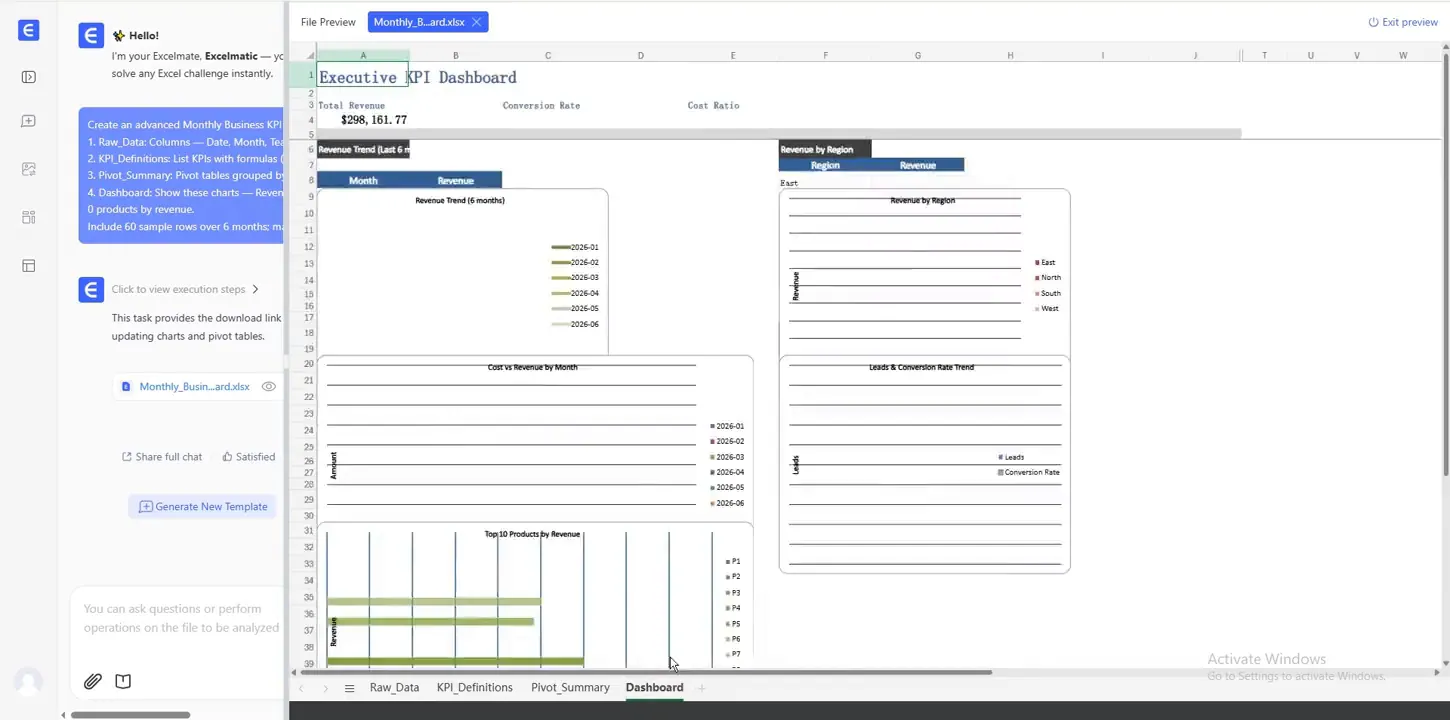
The table is intentionally asymmetric: RowSpeak has repository-hosted execution evidence here; Excel-native and BI behavior is described at the workflow level. It would be misleading to convert that difference into an accuracy or speed ranking.
When BI is the right investment
BI becomes valuable when the reporting process needs a managed semantic layer, reliable refreshes from many operational systems, broad sharing, and central governance. Typical signals include:
- several departments dispute the same KPI definition;
- reports combine CRM, ERP, product, support, and finance systems;
- data must refresh on a formal schedule without manual exports;
- many users need role-based access to the same dashboards;
- analysts spend more time reconciling metric definitions than analysing results.
In those situations, explore business intelligence workflows rather than trying to turn a set of spreadsheets into a permanent enterprise data platform.
Concrete differences: Excel assistant, RowSpeak, and BI
| Decision factor | Excel with workbook-native AI | RowSpeak file-to-report workflow | BI platform |
|---|---|---|---|
| Starting point | A workbook the analyst is already editing | Excel/CSV/PDF/image files and exported business data | Modeled data from databases, SaaS systems, files, or a warehouse |
| Best output | Controlled workbook, formula, table, or chart | Reviewable analysis, downloadable artifact, report, or dashboard | Governed shared dashboard and reusable semantic measures |
| Primary reviewer | Workbook owner | Report owner plus domain owner for mappings and KPIs | Data/BI owner plus business metric owner |
| Change visibility | Cells, formulas, comments, version history | Prompt, displayed analysis, exception/output artifacts | Model changes, lineage, refresh logs, permissions |
| Recurrence | Strong when the workbook template is stable | Strong when recurring exports need the same analysis/report path | Strong when sources and metrics need automated refresh at scale |
| Multi-file messiness | Manual Power Query/modeling or supporting workflows may be needed | Core use case, with mapping and exception review still required | Solved upstream through modeled ingestion and transformation |
| Governance ceiling | Workbook controls and team process | Reviewable file workflow; not a replacement for every enterprise semantic layer | Central definitions, access, lineage, refresh, and distribution |
| Common failure | Hidden dependency or manual override | Ambiguous mapping or unsupported explanation | Expensive model built before the reporting question stabilizes |
A 12-job decision matrix
| Reporting job | Start with | Why |
|---|---|---|
| Fix a broken lookup formula | Excel + AI formula assistance | The workbook is the working surface |
| Explain an unfamiliar workbook | Excel + AI | AI can accelerate orientation; the owner reviews logic |
| Merge three monthly exports | AI file workflow | File cleanup and mapping are the bottleneck |
| Build a one-off board chart | AI + chart tool | Fast exploration and visual drafting help |
| Produce a monthly management pack | AI file-to-report workflow | The work repeats but may start from exports |
| Maintain an audited model | Excel | Cell-level review and calculation ownership matter |
| Forecast a controlled scenario | Excel or specialist planning tool | Assumptions need explicit ownership |
| Explore a large, shared CRM dataset | BI or governed analytics | Multiple users need stable definitions |
| Monitor operational KPIs across systems | BI | Refresh, access, and consistency matter |
| Explain a budget variance from exports | AI + reviewer | AI can prepare analysis; finance approves it |
| Share a leadership dashboard from recurring files | AI dashboard workflow | Useful before a full BI model exists |
| Publish governed enterprise metrics | BI | Central definitions and controls are required |
The table is a starting point, not an architecture rule. A mature organisation may use all three: Excel for a controlled model, AI for file analysis and report drafting, and BI for enterprise dashboards.
Three workloads that reveal the boundary
Board scenario workbook: keep it in Excel. The deliverable is the model, reviewers inspect assumptions cell by cell, and a generated narrative is secondary.
Monthly regional pack from three exports: use a file-to-report workflow. The hard work is schema alignment, control totals, exception review, variance explanation, and consistent output sections.
Hourly operations dashboard for 500 users: use BI. Scheduled refresh, access control, one semantic definition, and monitoring matter more than conversational flexibility.
The practical middle layer
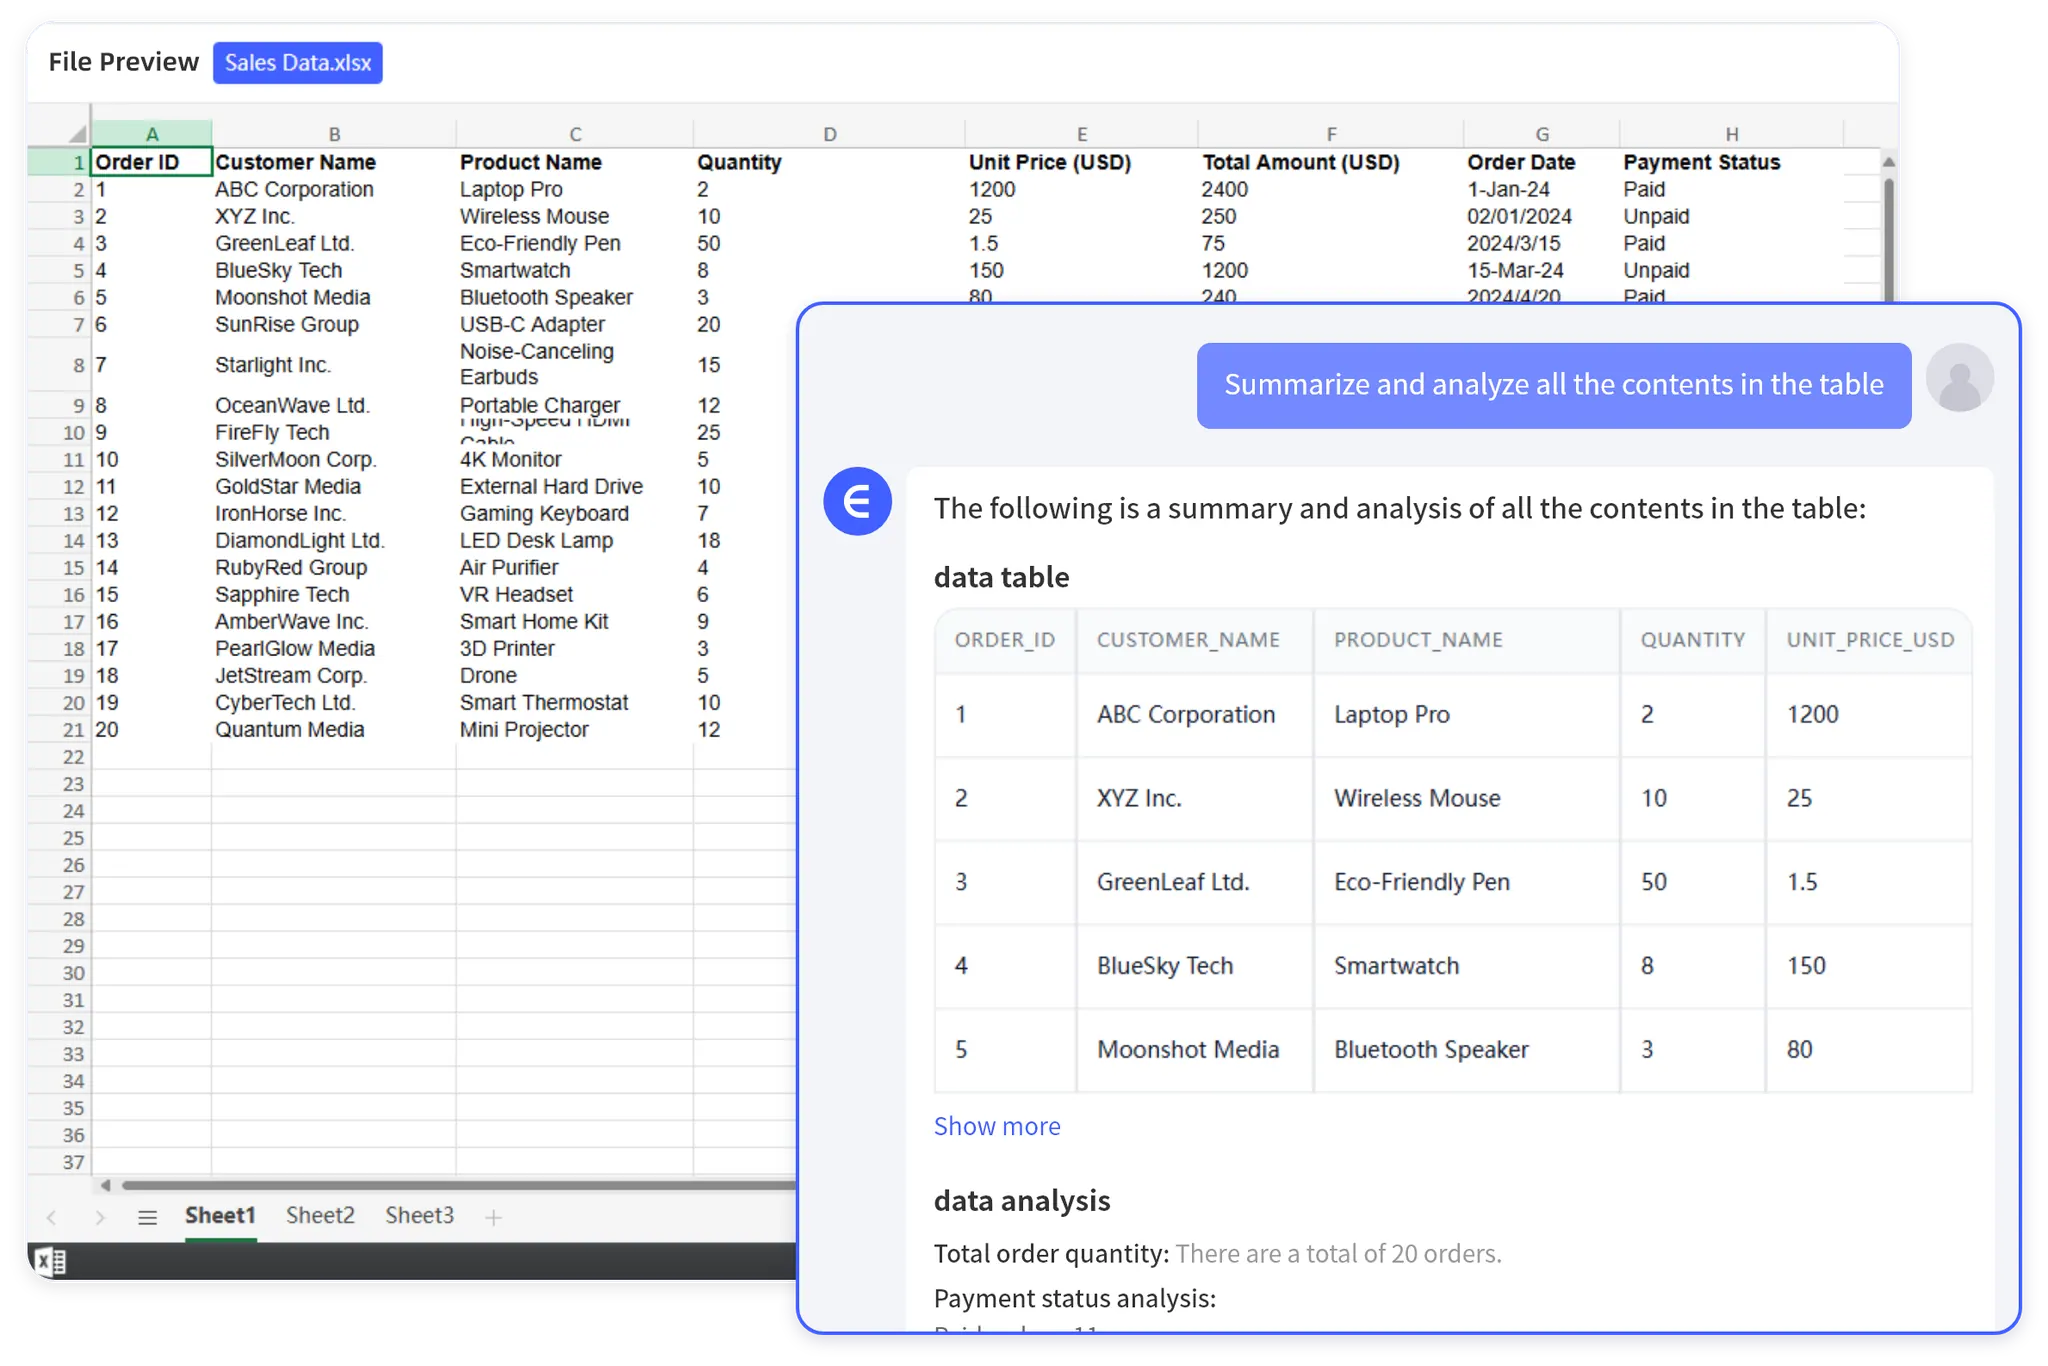
RowSpeak is designed for the middle layer between raw spreadsheet work and heavy BI. It helps teams turn Excel, CSV, PDF, screenshots, and image-based tables into answers, reports, and dashboards that can be reviewed and shared.
That is different from claiming that it replaces every Excel workbook or BI platform. Use RowSpeak when a business team needs a repeatable path from real files to an output, but does not need to build a full governed data model before the next reporting cycle.
For example, a management team can begin with a monthly management reporting workflow and later decide whether its most stable metrics should move into BI. This avoids waiting for a perfect future architecture before improving a painful current process.
Avoid three common mistakes
Treating AI as the source of truth. AI can analyse and explain, but documented business rules, source systems, and review owners still establish the official number.
Building BI for a process nobody has defined. If a monthly report has no agreed KPIs or audience, a dashboard project will not solve the underlying problem. Define the report first.
Keeping manual exports forever. If a file workflow is repeated, document it. When it reaches a scale where data governance and refresh requirements dominate, use that evidence to plan a BI investment.
Using row count as the architecture rule. A 50 MB one-off CSV may be easier to handle in a file workflow than a 2 MB workbook feeding a regulated metric. Choose based on recurrence, controls, users, and source-of-truth requirements.
Hiding failed evaluation runs. Record unsupported files, timeouts, row-count mismatches, wrong mappings, and reviewer corrections. A clean case study without failure evidence is marketing material, not an implementation guide.
When to move from the middle layer into BI
Use concrete triggers rather than a vague sense that the process is “getting big”:
- the same metric appears in three or more departmental reports with different definitions;
- refresh is needed more often than the source owner can safely export and review files;
- more users need access than a report owner can manage manually;
- corrections must flow back through a governed transformation rather than a one-time report;
- audit, lineage, or role-based access requirements exceed the file workflow;
- the metric has remained stable for several reporting cycles and is worth formalizing.
Until those triggers appear, a documented file-to-report workflow can be a valid operating layer—not a failed BI project.
Choose one next step
If your team spends hours each month reconciling exports and writing the same summary, start by mapping the current inputs, KPI rules, outputs, and review checks. Then run the downloadable workbook through the RowSpeak spreadsheet assistant workflow and compare the result with the control totals above.
If the requirement is central governance across many systems, use that same map to define the BI project. The right outcome is not “more AI” or “more dashboards.” It is a reporting workflow that produces a number your team can explain and act on.