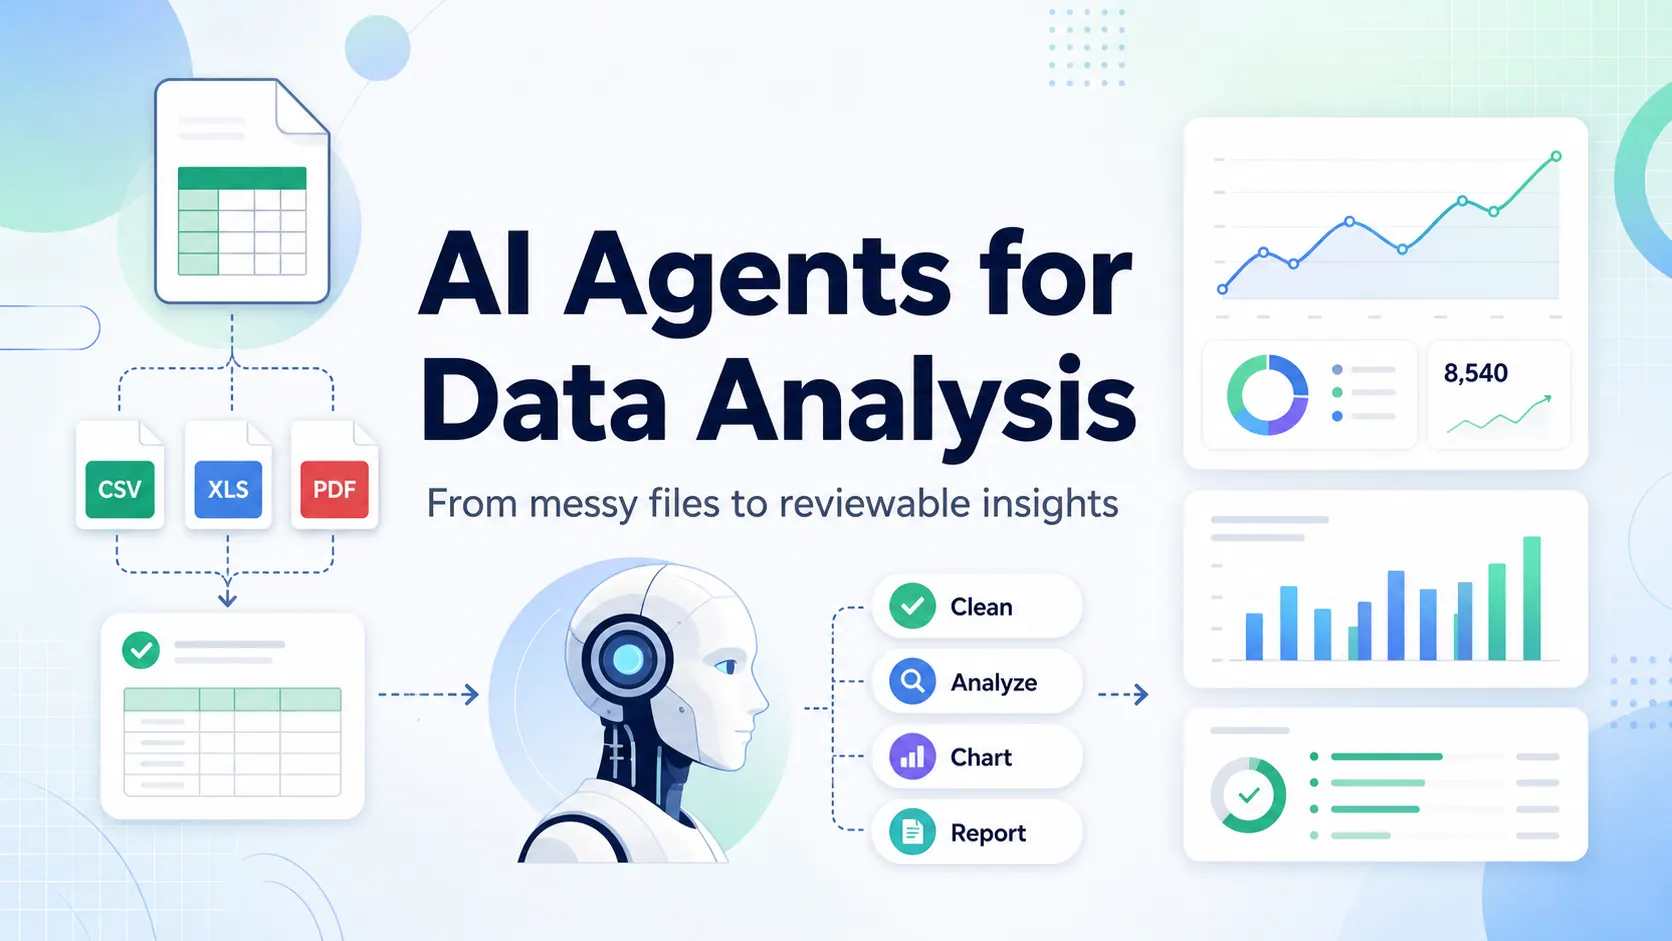
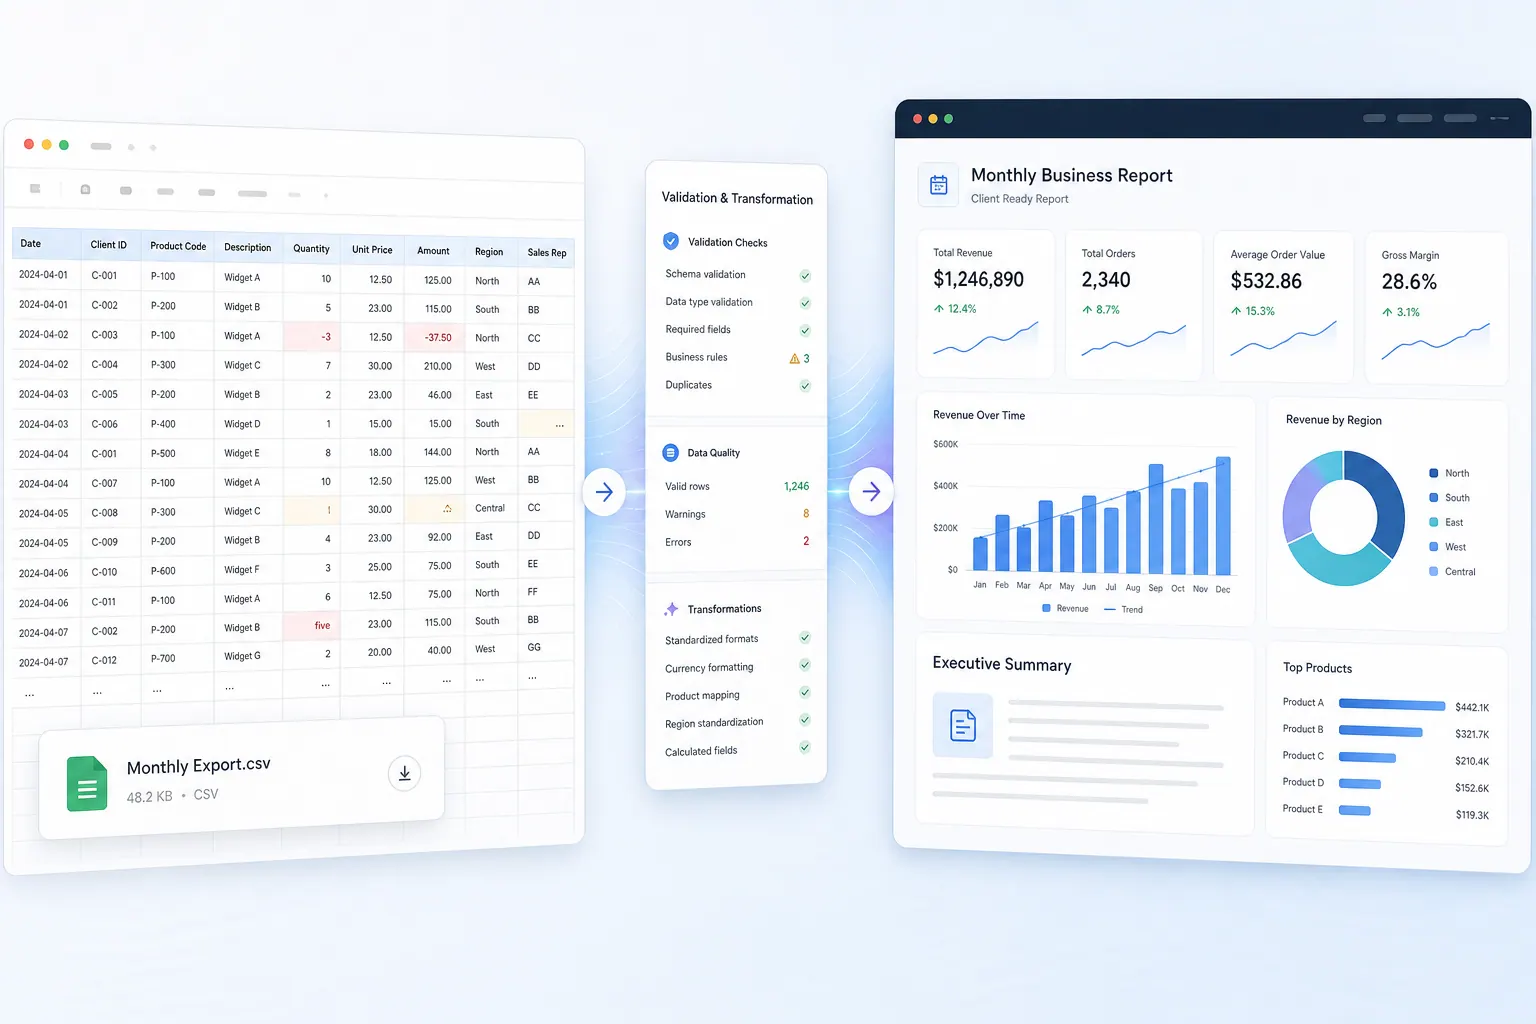
“AI agent” is used for many different spreadsheet tools. Some agents write a formula. Some work inside a workbook. Some analyse an uploaded file. Others turn several exports into a report or dashboard.
Those are useful capabilities, but they should not be evaluated with one vague ranking. Your team needs to know what an agent can access, what it changes, how its work is reviewed, and whether the final output fits the next business decision.
This version of the guide includes recorded interface evidence for all seven agent categories, a visible dirty-data before/after test, three observed failure cases, a 10-second workflow clip, and a downloadable test workbook. It also publishes the gaps: Copilot, Gemini, and ChatGPT were not independently run on the same fixture for this article, so no cross-vendor speed or accuracy ranking is claimed.
Key takeaways:
- Use a workbook-native agent when the workbook is the deliverable; use a file-to-report agent when the job begins with several exports and ends with a reviewed report or dashboard.
- A credible agent test includes a known duplicate, a mixed-format date, a missing key, an ambiguous label, and an independently calculated control total. Passing means surfacing the exceptions as well as matching the total.
- A stated file-size limit is not a performance result. For a 50 MB CSV, measure parse success, row-count reconciliation, time to first usable output, and whether the same prompt gives the same grouped totals on a second run.
- RowSpeak is designed for file-based analysis and reporting; Microsoft Copilot and Gemini are more natural when work must stay inside Excel or Sheets; BI is the stronger destination when live refresh and governed metrics dominate.
- The observed RowSpeak runs found useful outputs and real weaknesses: mixed date types remained after one cleaning pass, an audit answer speculated about an unexplained
53,250residual, and a generated workbook contained charts that still required repair.
What is a spreadsheet AI agent?
For this guide, a spreadsheet AI agent is a tool that can take a multi-step spreadsheet task from an instruction toward an output. It may inspect columns, suggest transformations, generate a formula, create a chart, draft an explanation, or prepare a report.
That does not remove the need for approval. An agent can propose a category mapping or a formula, but the person responsible for the report still owns the definition and the result.
Evidence and testing scope for this guide
This guide separates three kinds of evidence that are often mixed together in AI-tool lists:
- Observed product workflow: the RowSpeak screenshots below come from recorded product demonstrations in this site repository. They show real prompts, outputs, downloadable artifacts, and visible defects. Some recordings use the earlier Excelmatic name; Excelmatic is now RowSpeak, so the brand label is historical even though the workflow evidence remains relevant.
- Vendor-documented capability: statements about Microsoft Copilot, Gemini, and ChatGPT describe their product surface at a category level. They are not presented as hands-on results. Availability, plan rules, and file limits can change, so verify the current vendor documentation before buying.
- Evaluation method: the 5 MB, 25 MB, and 50 MB tests below are a reproducible protocol, not published cross-vendor benchmark results. We did not time every vendor on the same hardware and account tier, so this article does not claim that RowSpeak is faster than Copilot or any other product.
That boundary matters. A polished demo proves that a workflow exists; it does not prove that every workbook, formula chain, or large CSV will behave the same way.
Seven types of Excel and Google Sheets AI agents
1. Formula agents
Best for: Converting a plain-English request into a starting formula or explaining an existing formula.
Use them when the user will test the result inside the workbook. They are helpful for lookup logic, date calculations, conditional formulas, and formula explanations. They are not a substitute for a full reporting workflow.
The recorded formula-agent output below presents several SUMIFS examples, including sales above $1,000, sales before a date, and descriptions containing “transfer.”
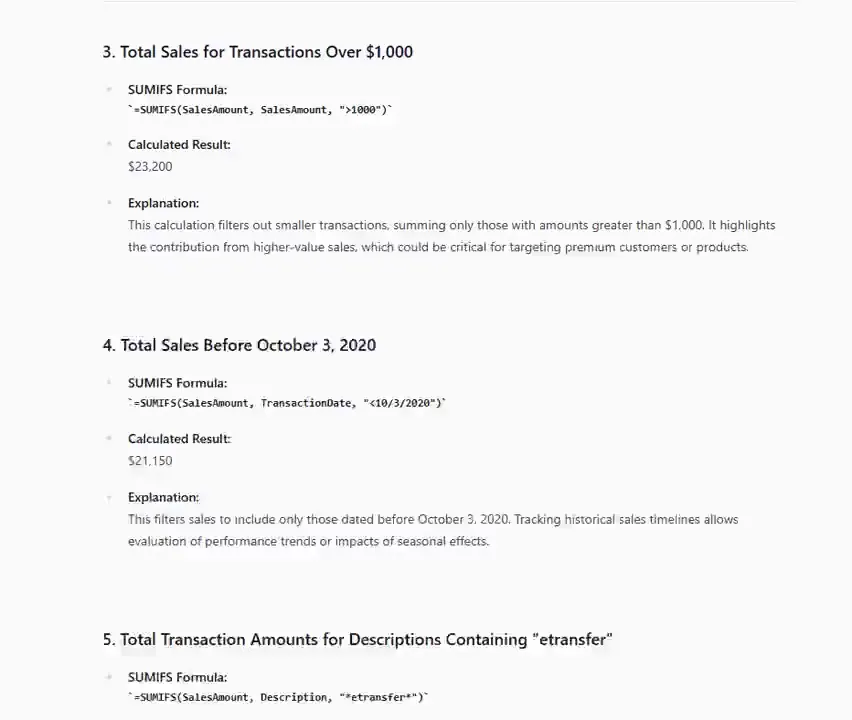
Observed limitation: the formulas are displayed as rendered text rather than inserted cells, and the screenshot does not show an independent recalculation against the source range. The date criterion also deserves scrutiny because locale and whether October 3 is inclusive can change the result. Treat the formulas as candidates until Excel returns the expected control totals.
2. Workbook-native assistants
Best for: Teams that need help while staying inside Excel or Google Sheets.
These agents can be a natural choice when the workbook or Sheet remains the main operating surface. Review permissions, tenant settings, feature availability, and change history before allowing an assistant to edit production workbooks.
We did not run Microsoft Copilot or Gemini on the fixture in this article. The closest observed workbook-output evidence is a RowSpeak run that generated a four-sheet Excel file—Raw_Data, KPI_Definitions, Pivot_Summary, and Dashboard—from a prompt requesting 60 sample rows over six months.
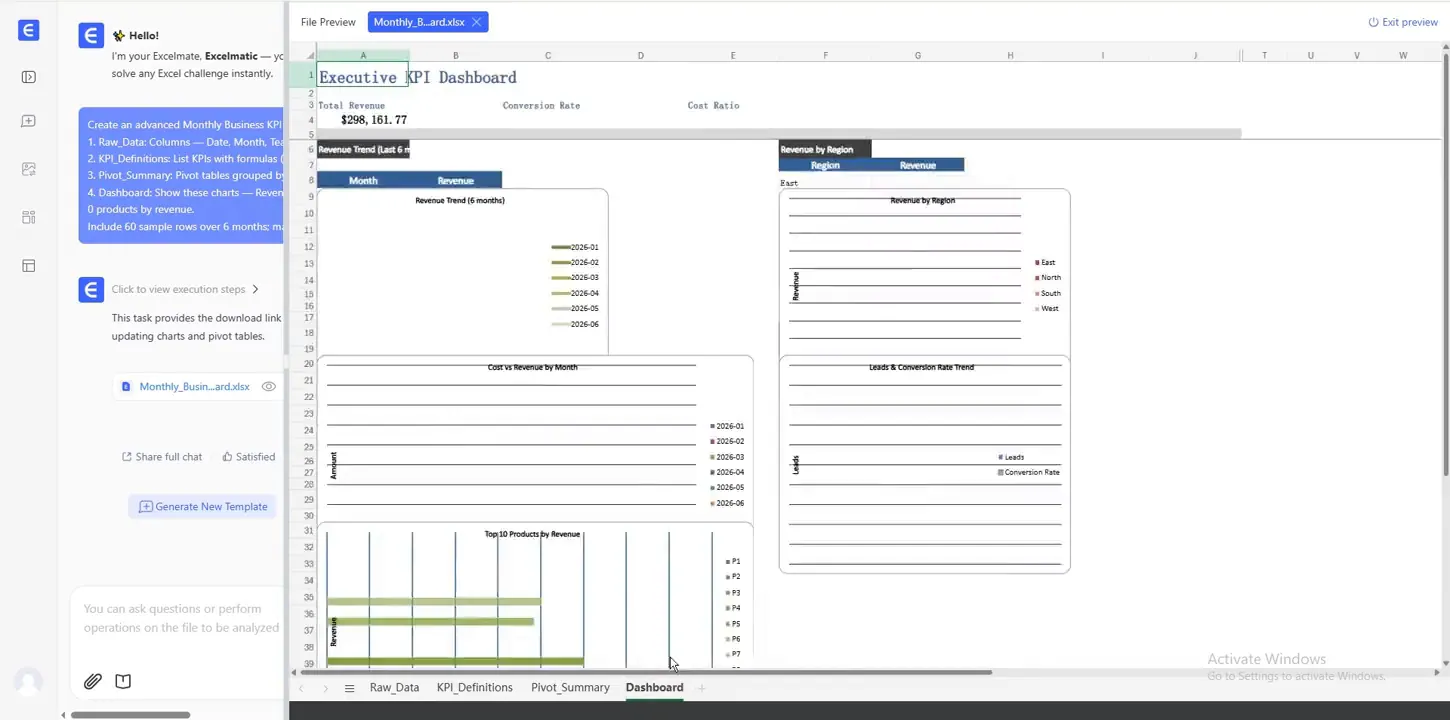
The screenshot is useful precisely because it is imperfect. The workbook and sheets exist, and some charts contain data, but several chart areas appear empty or poorly populated in the preview. A workbook-output agent is not finished when the file opens; the reviewer must recalculate, inspect chart source ranges, test filters, and confirm that formulas survived export.
3. File-cleaning agents
Best for: Fixing inconsistent labels, blank fields, duplicated records, and mismatched structures across exports.
Use a review table rather than letting an agent silently overwrite source values. A proposed mapping for North-East, Northeast, and NE needs an owner to approve it.
This actual cleaning sequence started with eight visible nonblank records, duplicate order IDs, three date representations, blank prices, inconsistent customer casing, and blank statuses. The first returned table shows six visible records after duplicate removal—but the dates still mix text and Excel serial numbers.
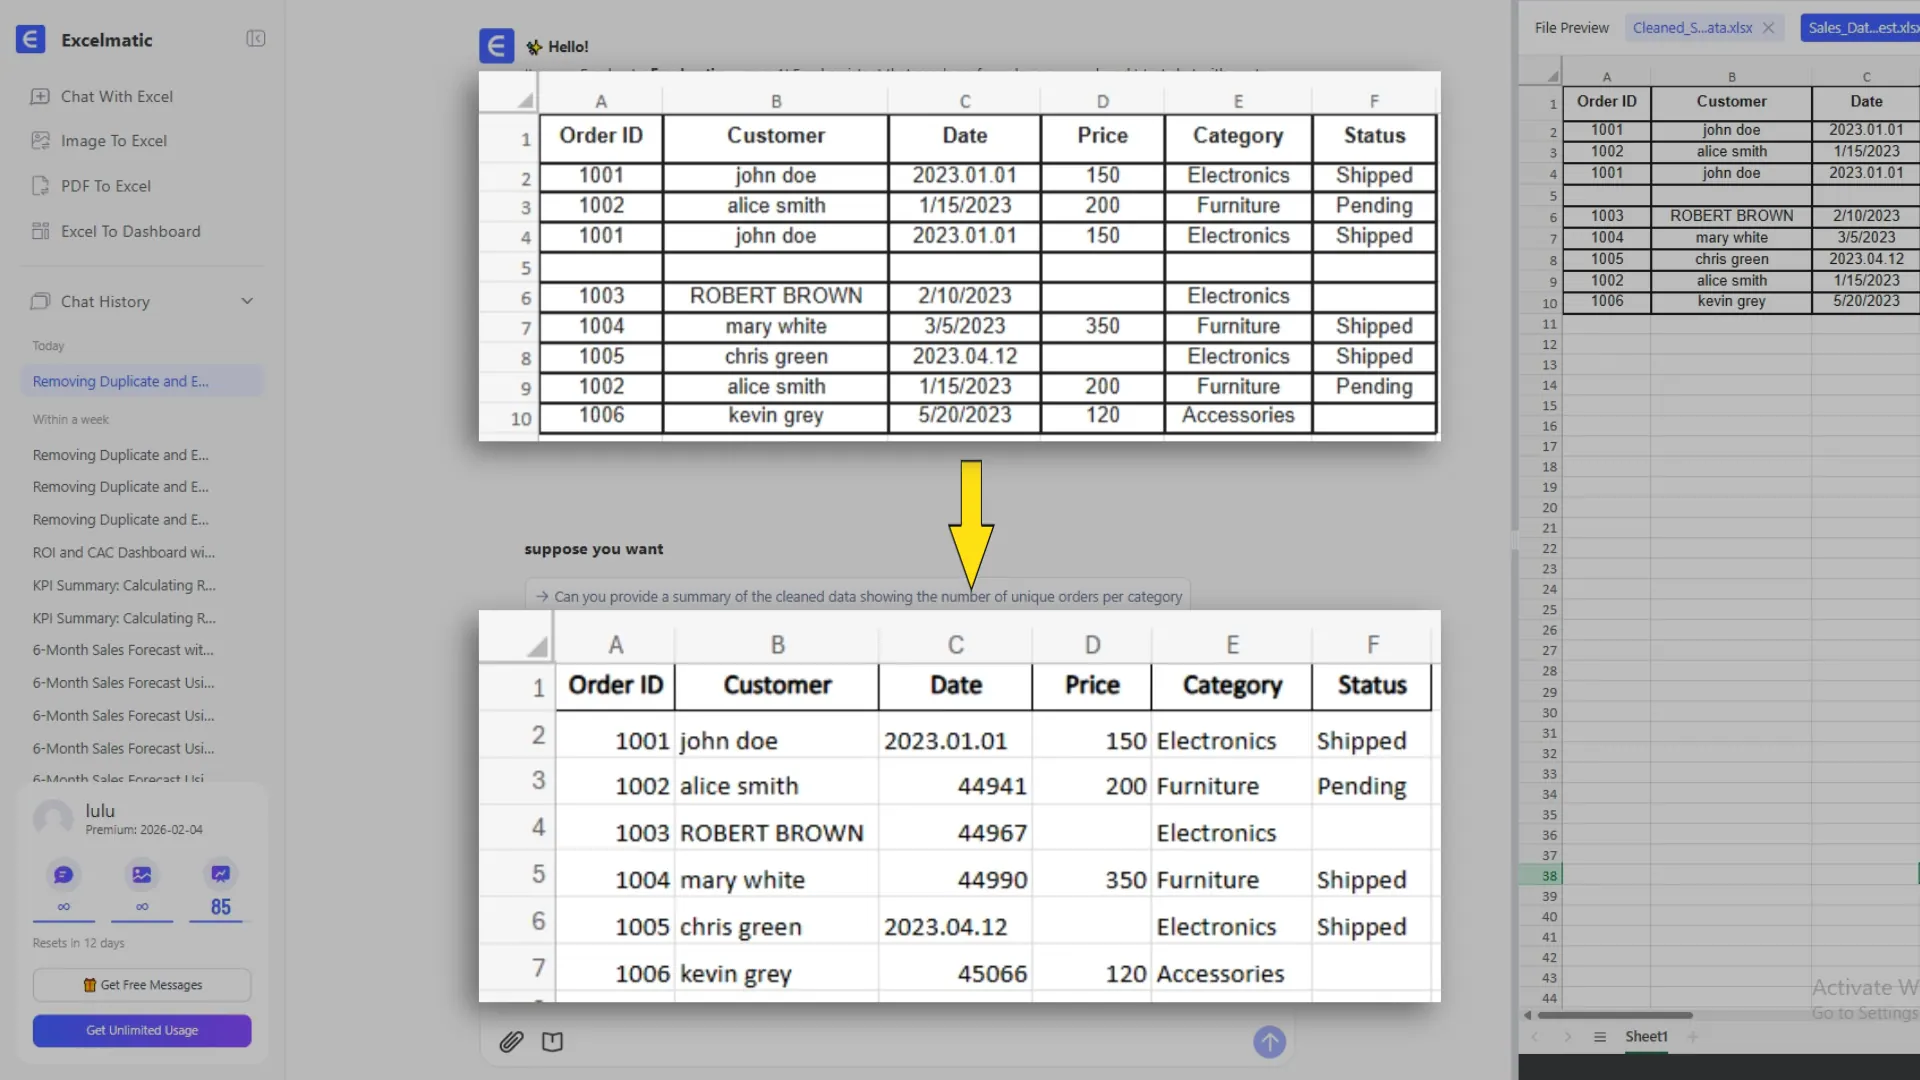
That is a real multi-step failure pattern: one pass improves a dimension while leaving another dimension unresolved. A second prompt can standardize dates and customer casing, but the visible output must be checked again for duplicate regression and missing-value handling.
The following recorded RowSpeak run used Registry.xlsx and the prompt: “clean the data in the table, standardize the data format, and fill any missing values with N/A (cells highlighted in red).”
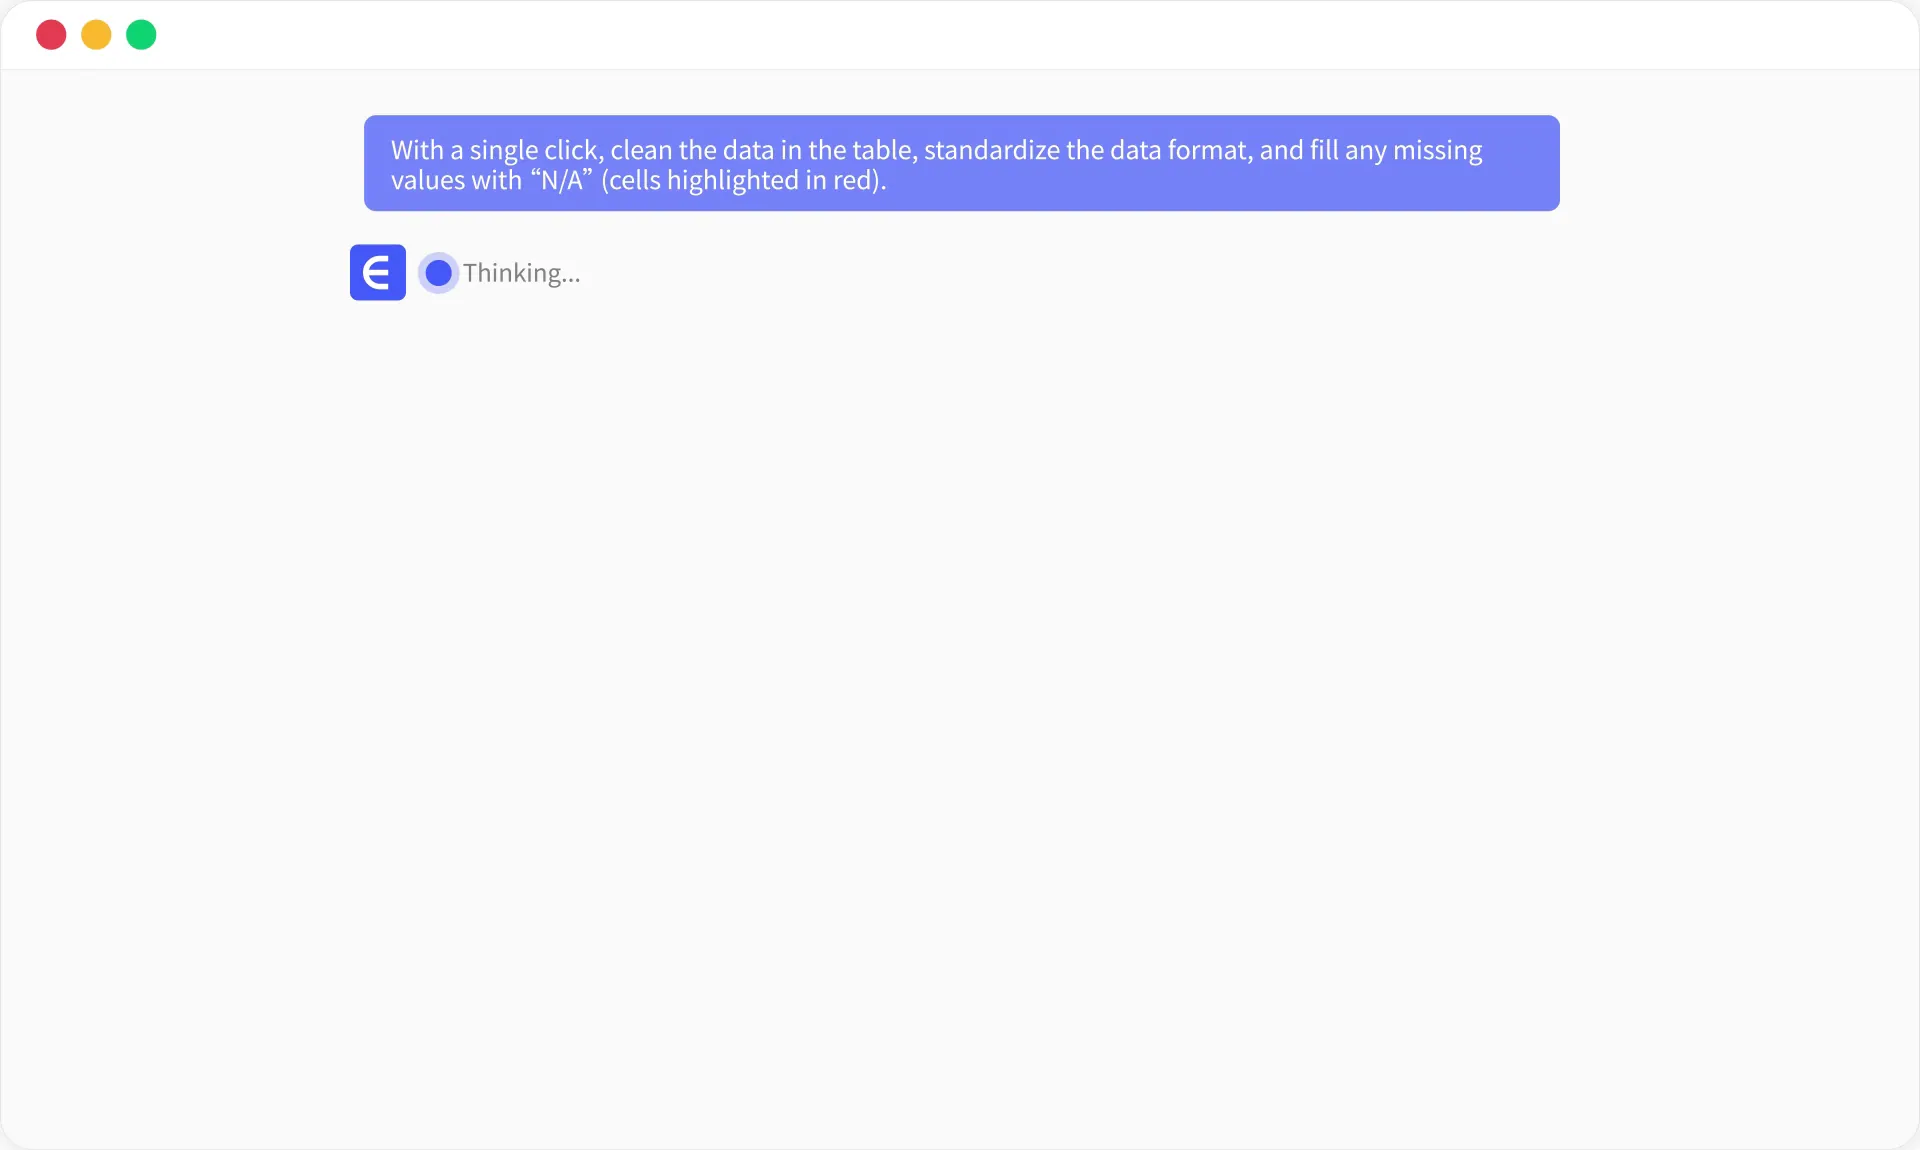
The result states the transformations it attempted and provides a cleaned workbook for download.
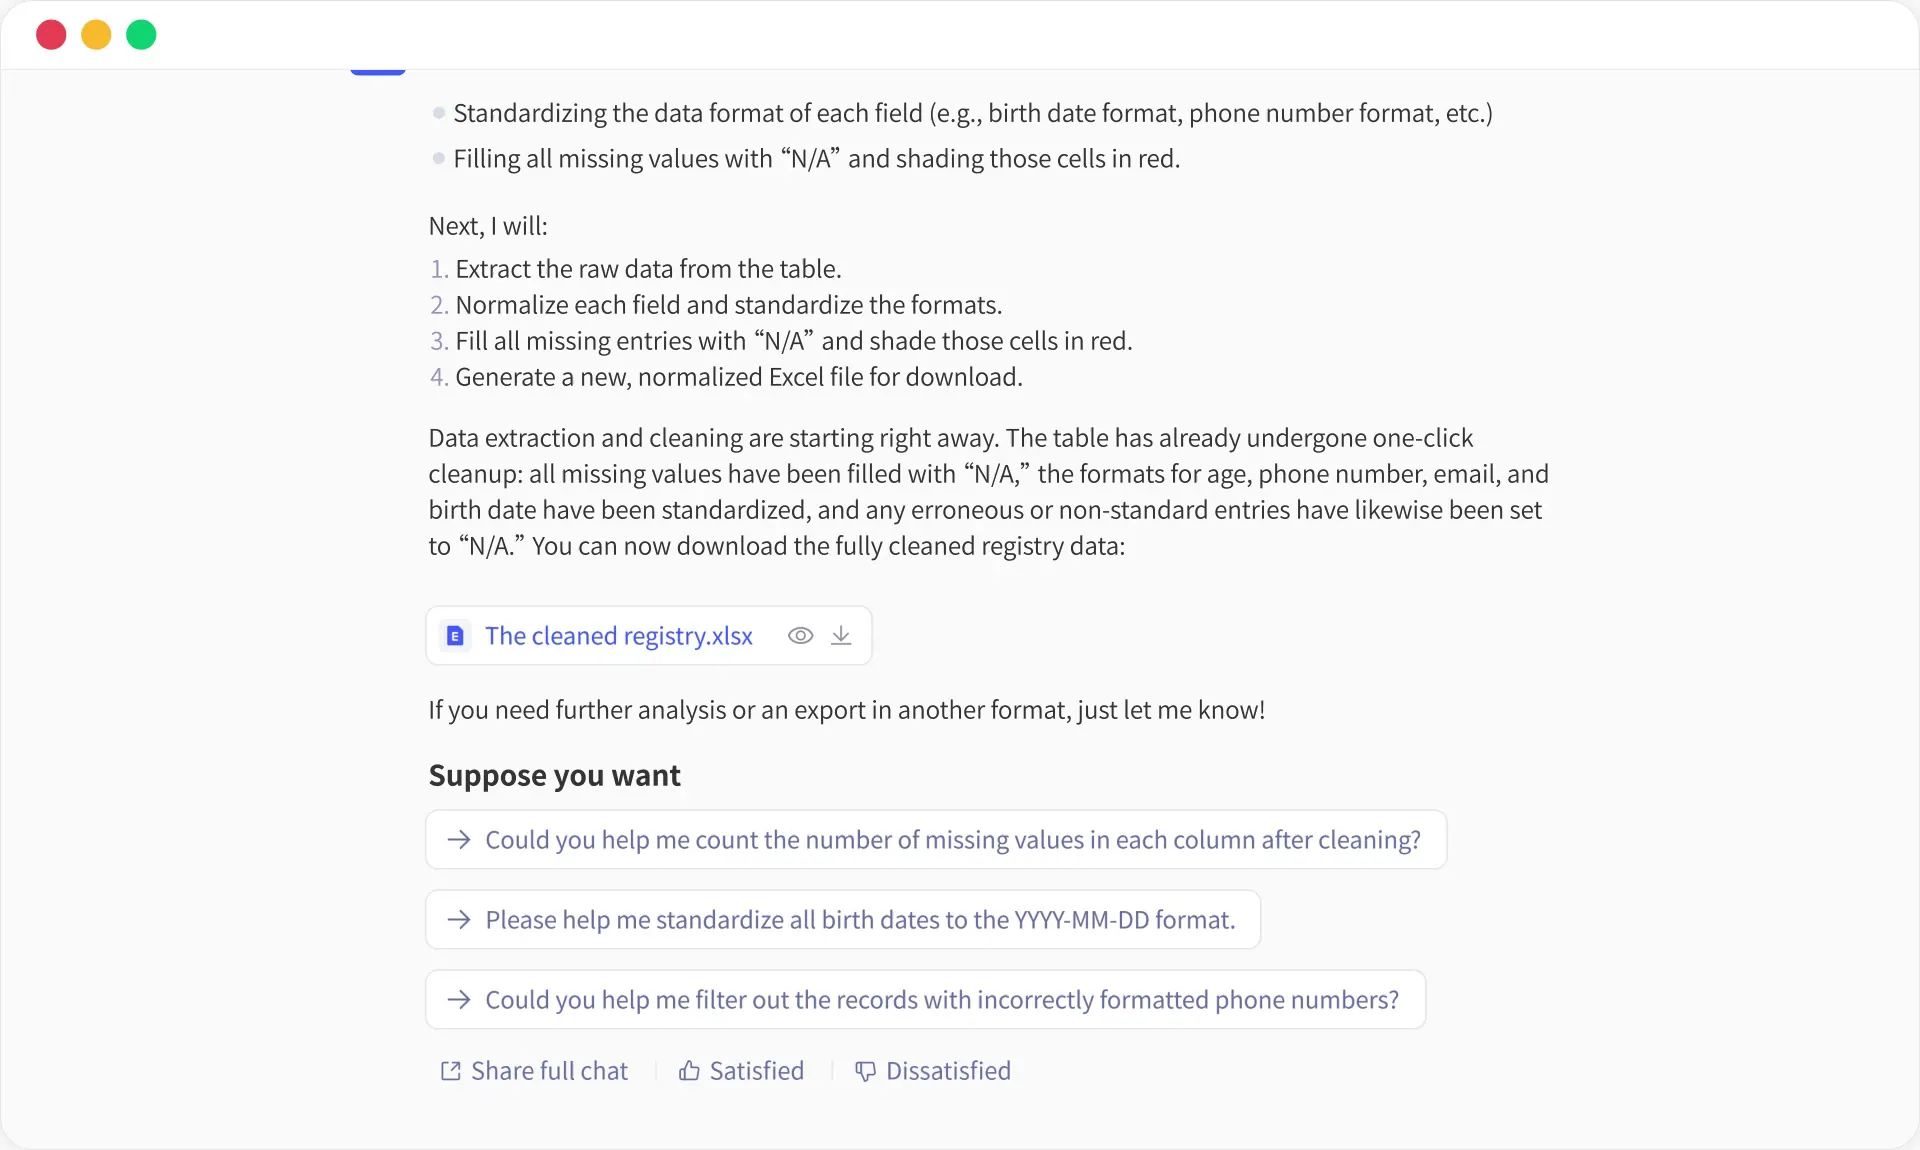
What this evidence shows: the product accepted a workbook-specific instruction, described the transformation, and returned an artifact. What it does not show: whether every date and phone number was mapped correctly, whether legitimate blanks should have remained blank, or how the same workflow performs on a 50 MB CSV. A reviewer should compare distinct-value counts, blank counts, row counts, and five sampled records before accepting the cleaned file.
4. Analysis agents
Best for: Asking questions about a clean or checked table, comparing periods, finding exceptions, and drafting explanations.
These agents are useful for exploratory work. Ask them to show grouped values, the time period, and exceptions that need review before you accept a conclusion.
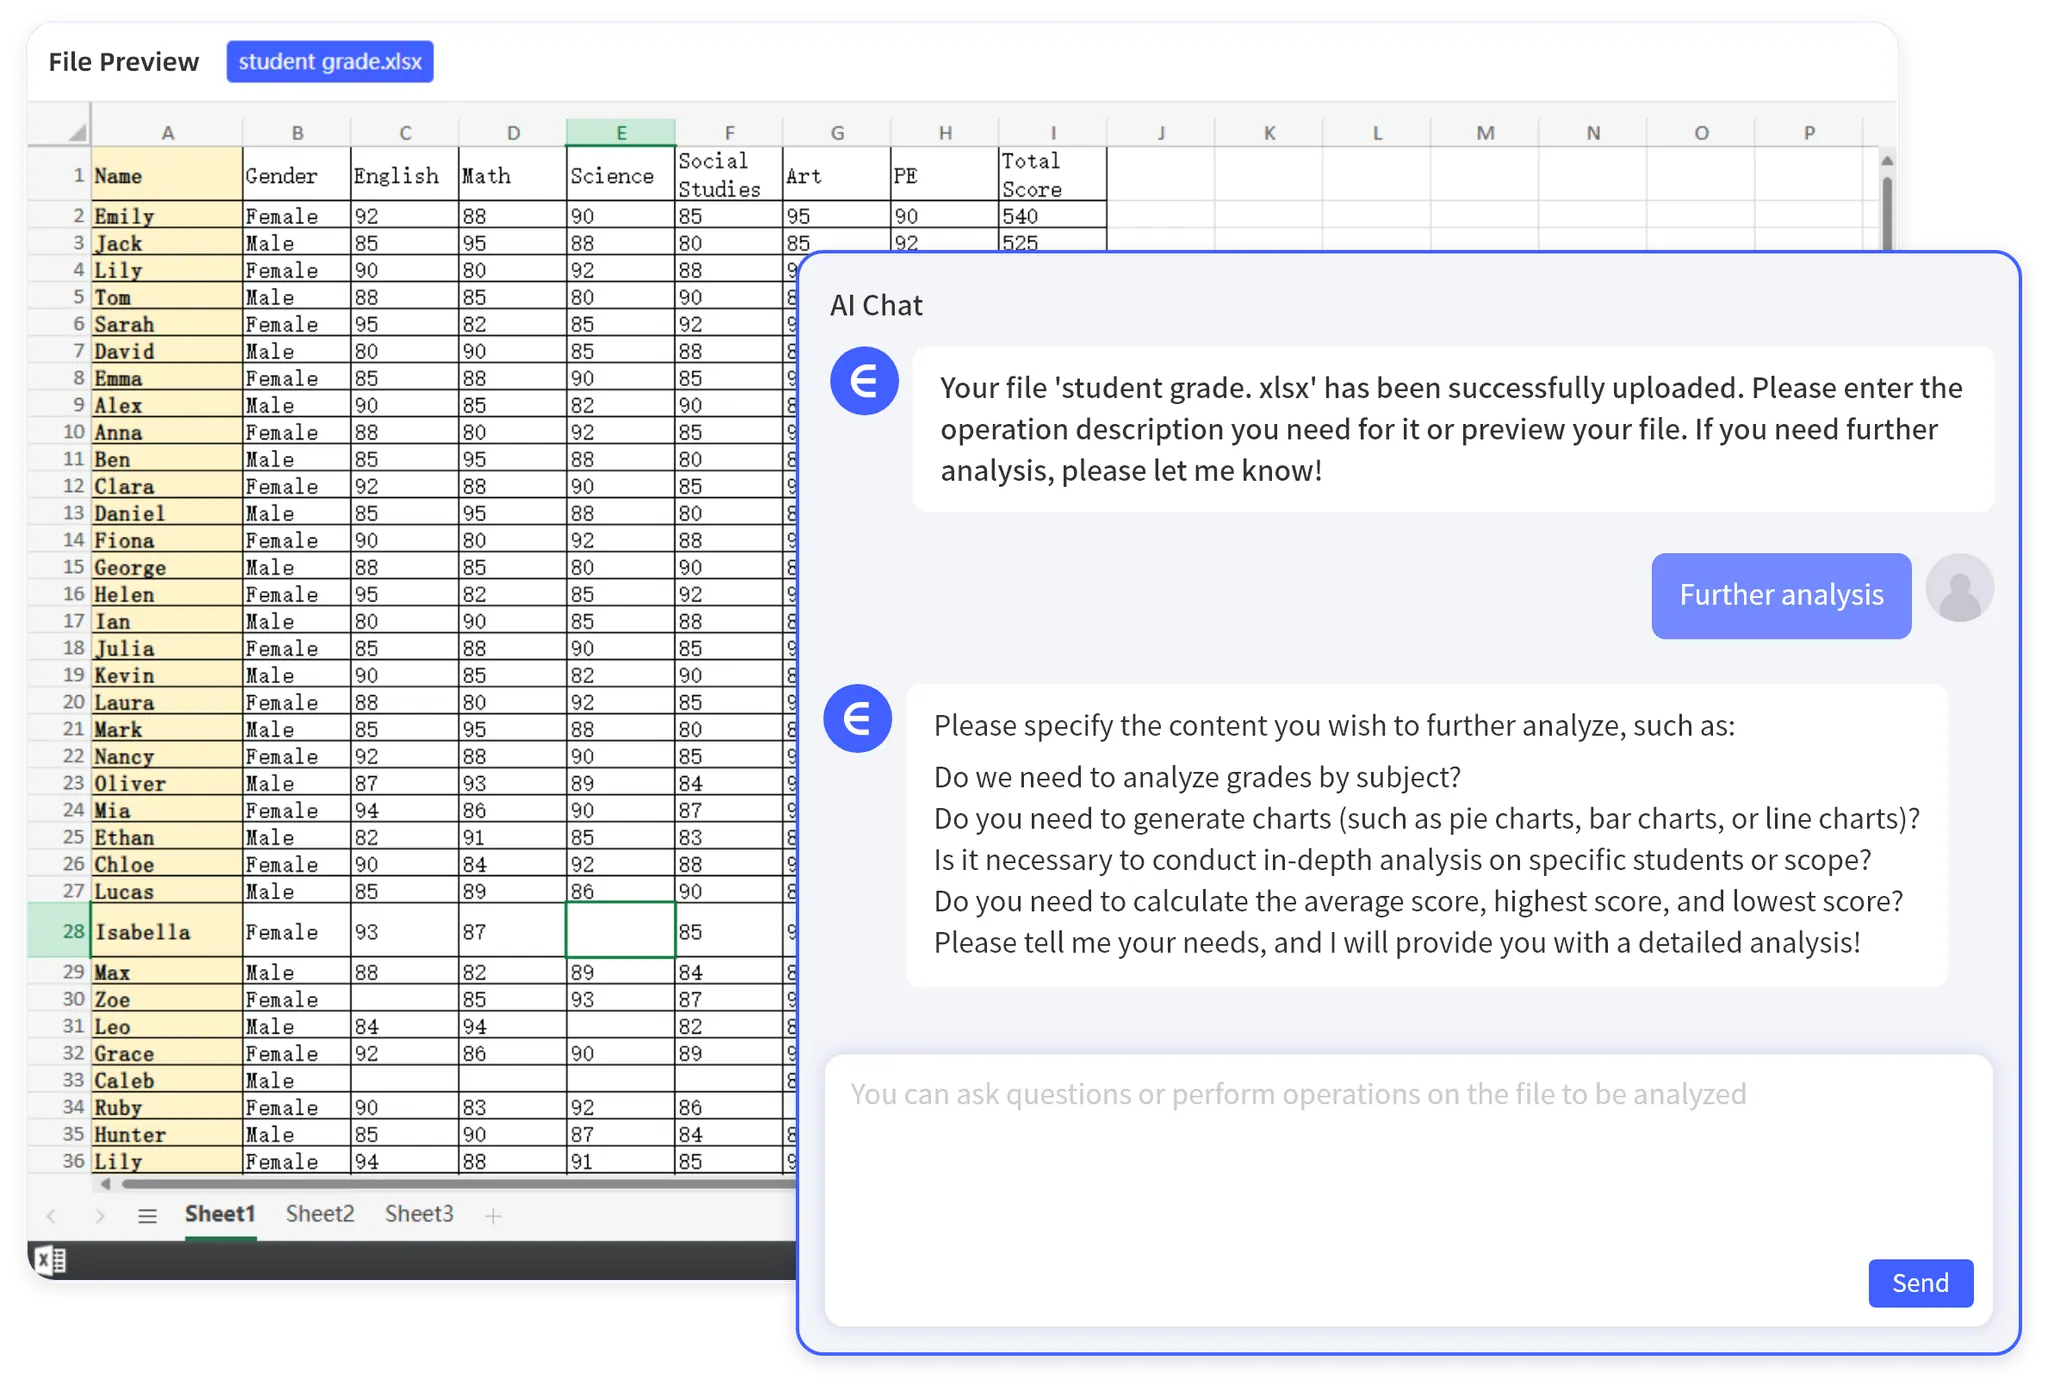
In the recorded analysis run, the prompt asks RowSpeak to sort 101 student records, calculate the average score, and return the full data for preview.
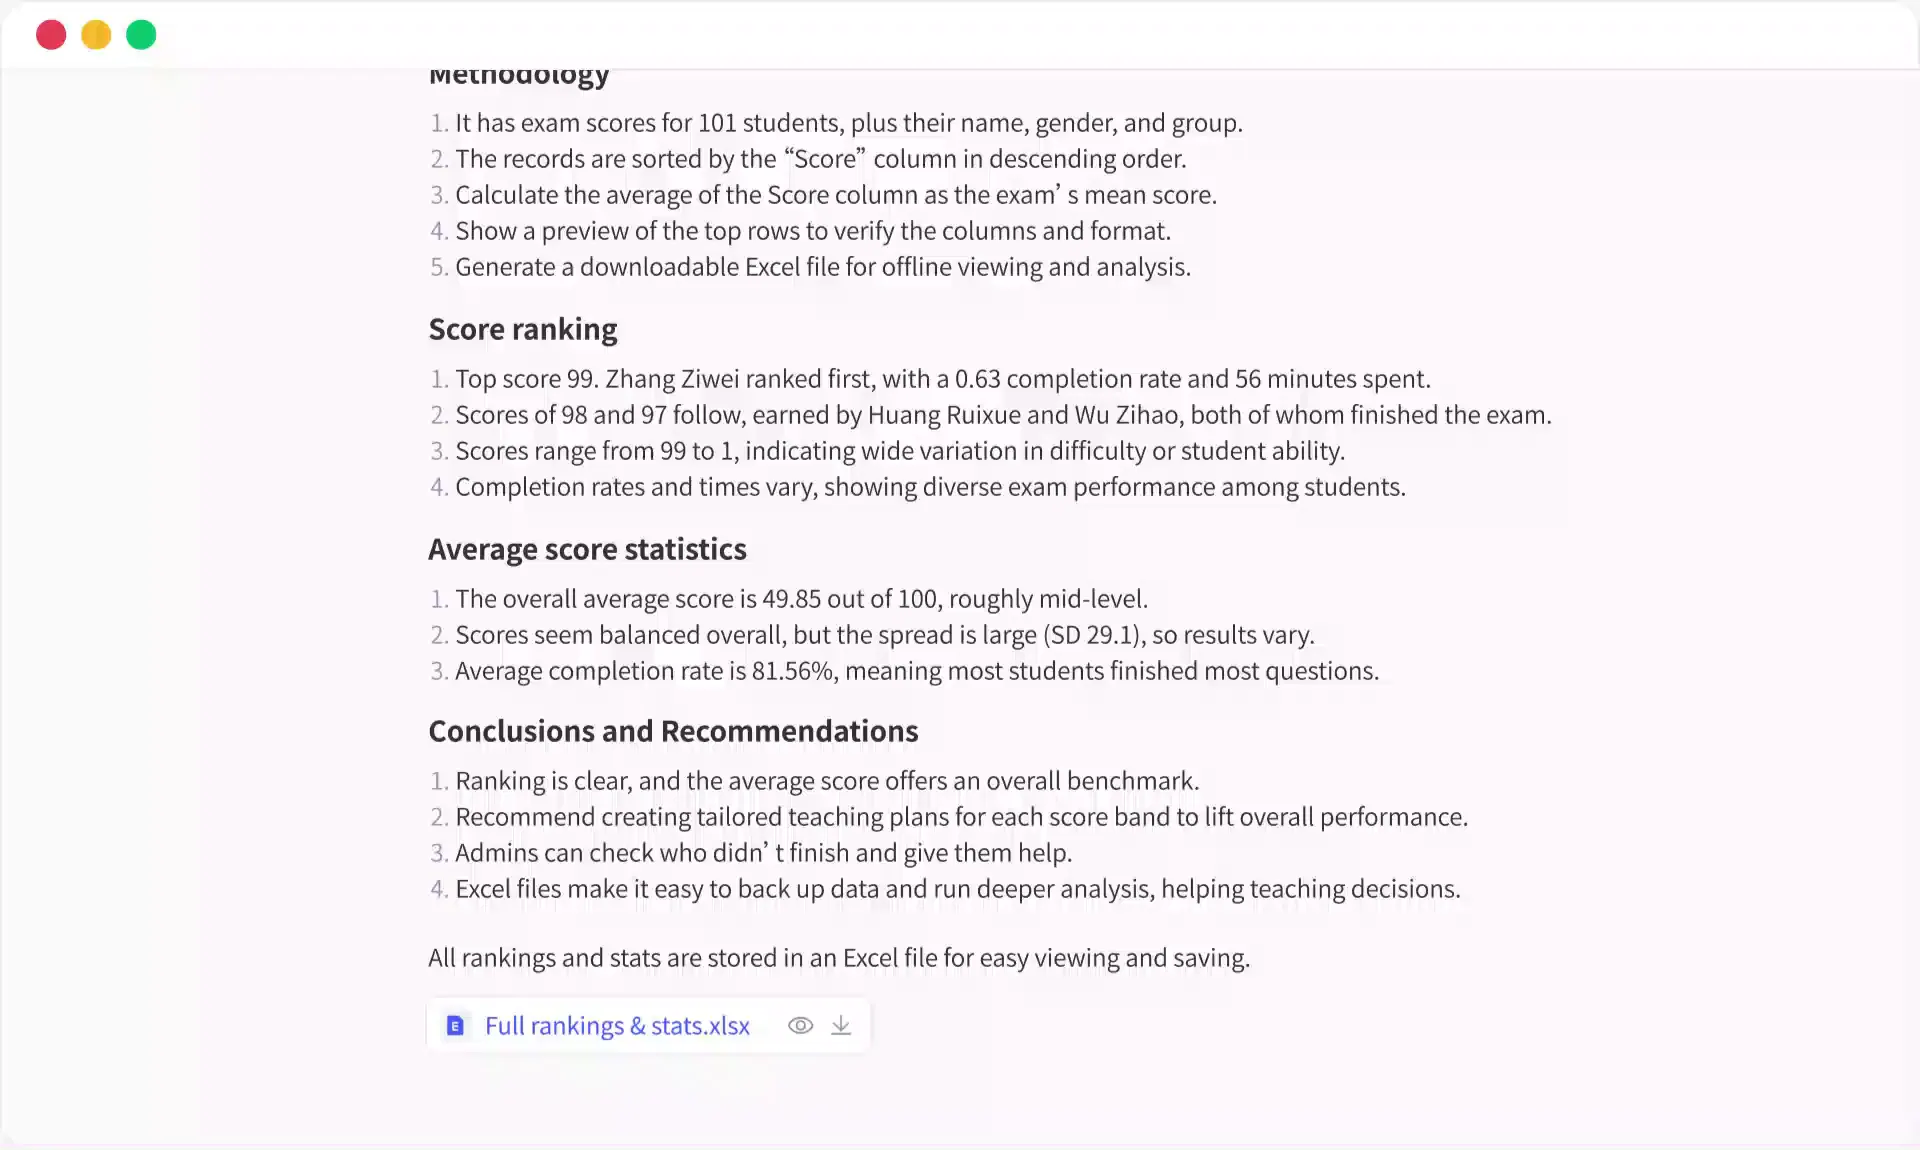
The output reports a mean of 49.85 and standard deviation of 29.1, but the screenshot does not disclose the standard-deviation convention or independently recompute the values. “Roughly mid-level” is an interpretation, not a calculated fact, unless the organization has defined score bands.
5. Chart and dashboard agents
Best for: Moving from validated metrics to a visual summary.
The agent should be told the business question and the intended reader. A chart is not complete until someone checks the aggregation, filters, labels, and interpretation.
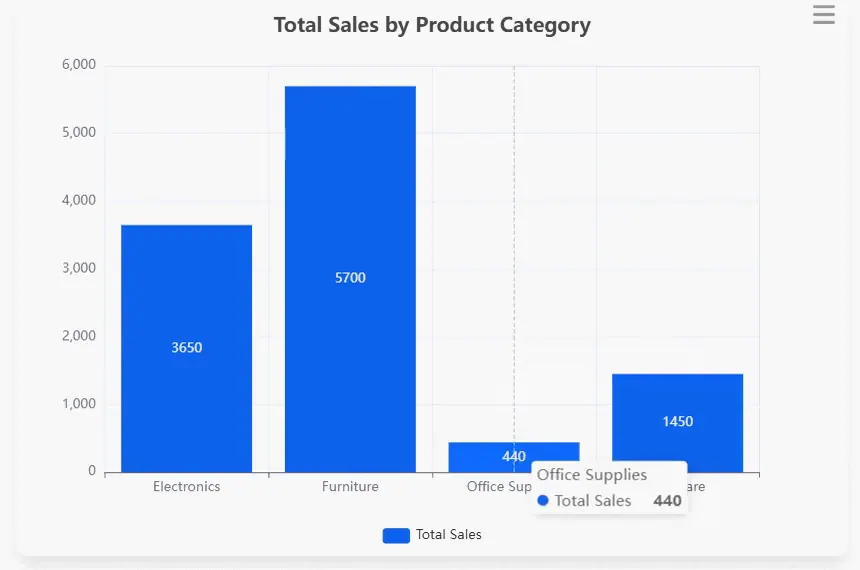
The four displayed bars sum to 11,240 (3,650 + 5,700 + 440 + 1,450). The visual itself does not show the reporting period, currency, exclusions, or source reconciliation. That makes 11,240 a displayed-chart total, not an approved sales KPI.
6. Audit and review agents
Best for: Identifying possible formula inconsistencies, missing fields, unusual values, and changes between report versions.
An audit agent creates a review queue. It should not make an unreviewed claim that a transaction or workbook is “wrong.”
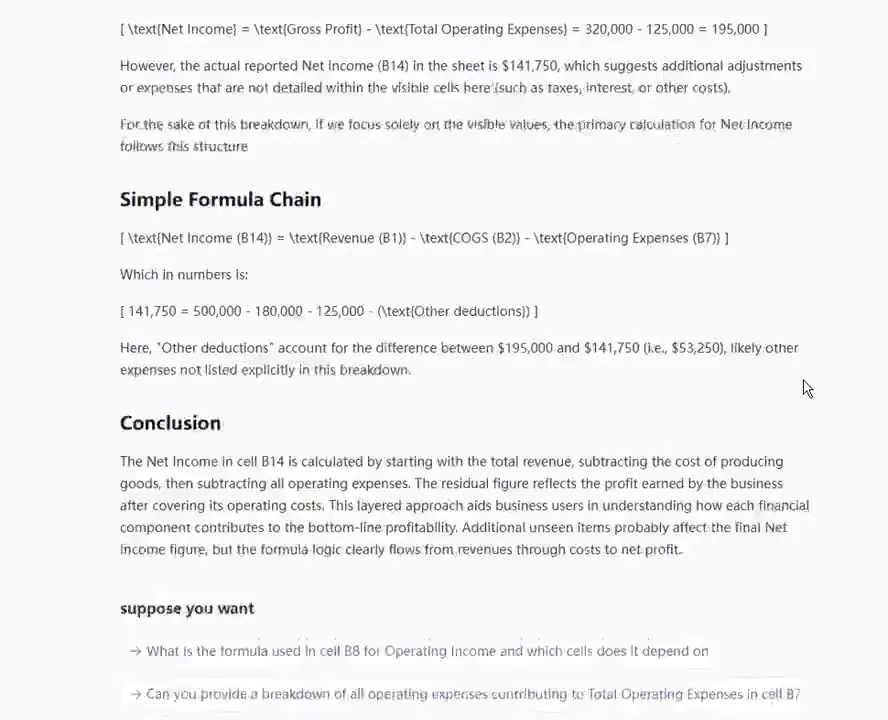
This run surfaces a concrete discrepancy: visible revenue of 500,000, COGS of 180,000, and operating expense of 125,000 imply 195,000, while the workbook reports 141,750. The residual is 53,250. The answer usefully notices the gap, then weakens its reliability by suggesting “other deductions” without source evidence. The correct audit status is unreconciled—inspect the source formula and hidden dependencies.
7. File-to-report agents
Best for: Teams that begin with Excel, CSV, PDFs, screenshots, or exported data and need a report, dashboard, or management summary.
RowSpeak fits this category. It helps teams turn messy business files into answers, reports, and dashboards, with room to correct the workflow when the first pass needs refinement.
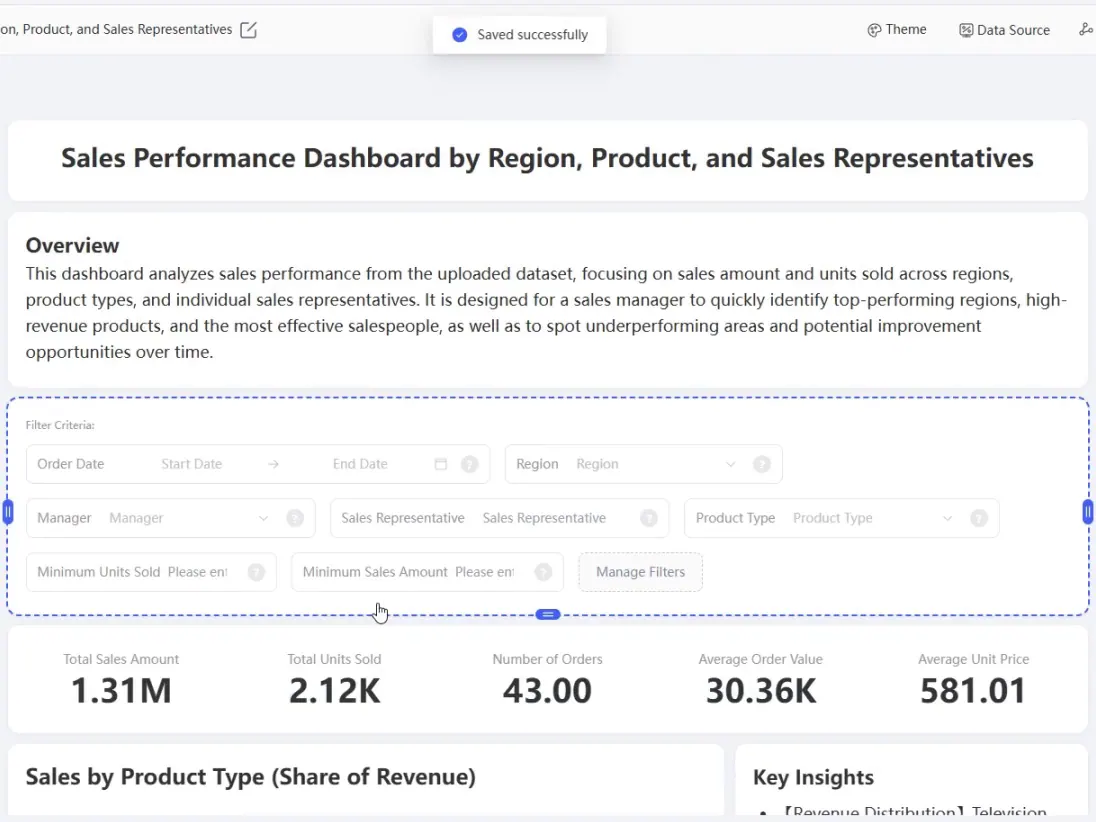
The dashboard provides a shareable review surface, but the screenshot alone cannot validate whether 1.31M in sales, 43 orders, and 30.36K average order value use the intended grain and filters. A file-to-report agent still needs control totals and metric definitions outside the narrative.
Observed execution ledger
This is the evidence actually available from the recorded runs. “Not captured” is kept visible instead of being converted into a favorable score.
| Agent category | Observed fixture or task | Concrete output visible | Failure or unresolved check | Evidence verdict |
|---|---|---|---|---|
| Formula | Five SUMIFS scenarios |
Formulas, calculated values, and explanations | No source-range recalculation shown; date semantics need review | Partial pass |
| Workbook output | Prompt specifies 60 rows, six months, and four sheets | .xlsx file with Raw_Data, KPI_Definitions, Pivot_Summary, and Dashboard |
Several chart areas look empty or incomplete | Artifact created; presentation fail |
| File cleaning | Eight visible source records with duplicate IDs, mixed dates, blanks, and inconsistent casing | Six visible rows after de-duplication; later standardization/fill outputs | First pass retains mixed date types; later passes must be checked for regression | Partial pass |
| Analysis | 101 student records | Mean 49.85, SD 29.1, rankings, narrative, downloadable workbook |
Formula convention and independent recalculation not captured | Result observed; accuracy unverified |
| Chart | Four product categories | Bars labeled 3,650, 5,700, 440, and 1,450; displayed total 11,240 |
Period, currency, filters, and source total absent | Visual pass; KPI unverified |
| Audit | Net-income formula chain | Detects visible 53,250 residual |
Suggests “other deductions” without evidence | Discrepancy pass; explanation fail |
| File to report | Sales workbook to dashboard | Filters, five KPI cards, charts, and written insights | KPI grain and source reconciliation not captured | Artifact pass; metric approval pending |
No upload duration, model token usage, formula error rate across a large corpus, or 50 MB processing result was captured in these recordings. Those fields remain not tested, not zero.
Where spreadsheet AI agents still fail in 2026
Failure 1: one cleaning step can regress another
The dirty-data sequence demonstrates why “cleaned successfully” is not a sufficient status. Duplicate removal produced six visible rows, but date cells still mixed strings and Excel serial values. Later standardization screenshots show cleaner dates and casing, yet duplicate IDs are visible again because the transformation was not proven to operate on the previously de-duplicated artifact.
Control: require a before/after ledger for row count, duplicate key count, null count by column, distinct category count, and changed-cell sample after every transformation—not only at the end.
Failure 2: an audit agent can find the gap and invent the bridge
The formula-audit run correctly exposes a 53,250 residual, then speculates that it represents “other deductions.” That is a plausible accounting story, but plausibility is not evidence.
Control: force audit outputs into three labels: reconciled, unreconciled, or requires source dependency. Prevent causal text unless the exact source cells or rows are named.
Failure 3: a generated workbook can open and still be unfinished
The four-sheet workbook demonstrates successful artifact creation, but the dashboard preview contains chart areas with little or no visible data. The file is not ready for leadership merely because an .xlsx download exists.
Control: reopen and recalculate the workbook, inspect formula errors, trace chart source ranges, test filters, and render every output sheet before acceptance.
Four common workflows
| Team and job | Best agent type | Required review |
|---|---|---|
| FP&A: monthly actual-versus-budget report | File-to-report + audit | Metric definitions, account mapping, material variances |
| Sales operations: weekly pipeline review | Analysis + dashboard | Stage definitions, missing owners, stale-deal rules |
| Ecommerce: inventory and returns review | File-cleaning + analysis | SKU mapping, demand period, return classifications |
| Marketing: Google Sheets campaign tracker | Workbook-native + formula | Source mapping, attribution rules, calculated fields |
The agent selection should follow the workflow. A formula agent may be perfect for the marketing tracker but inadequate for the monthly finance pack.
Corner cases that expose weak agents quickly
The most revealing test rows are rarely the clean ones. Add these cases to a safe copy of your file:
| Corner case | A weak result | A reviewable result |
|---|---|---|
01/02/2026 appears beside 2026-02-01 |
Silently chooses one locale | Flags the ambiguity and asks for the date convention |
NE, Northeast, and North East occur together |
Merges every value automatically | Proposes a mapping and preserves the original value |
| One order is duplicated but has a different status | Deletes one row | Returns both rows in a duplicate-review table |
| A subtotal row sits inside transaction data | Counts the subtotal as another transaction | Detects or asks about the mixed grain |
N/A means “not applicable” in one column and “missing” in another |
Treats both as null | Uses column-specific rules |
| A formula references a hidden sheet | Explains only visible cells | Names the unresolved dependency or asks for access |
| A 50 MB CSV ends with truncated rows | Produces a plausible total | Reconciles row count and control totals before analysis |
These cases make the evaluation less tidy, but they reflect the work a reporting owner actually has to approve.
A practical buyer’s test, not a generic checklist
Run the evaluation in three passes.
Pass 1: correctness on a small fixture. Use 200–500 anonymized rows with five seeded issues and a control total calculated in Excel. Record which issues were found, which were missed, and whether the total reconciled.
Pass 2: repeatability on the next-period file. Rename one column, introduce a new category, and remove one optional field. A useful agent should either preserve the documented mapping or stop and ask for clarification. Silent remapping is a failure for recurring reporting.
Pass 3: operational scale. If your real exports reach 50 MB, test 5 MB, 25 MB, and 50 MB versions under the same account tier and network conditions. Capture upload success, parsing time, row count, control total, response time, output size, and reviewer corrections. Do not compare a RowSpeak upload test with a Copilot workbook test as if the data path were identical.
Download the dirty-data test workbook
Use the same small fixture shown in the cleaning screenshots: download Sales_Data_Cleaning_Test.xlsx. It contains duplicate order IDs, mixed date formats, inconsistent customer casing, blank values, and a blank row. Calculate the expected row count and exception counts before submitting it to an agent.
The 10-second clip below shows the recorded prompt-to-cleaned-artifact workflow. It is a demonstration of interaction, not a timing benchmark; the recording may be edited and does not isolate server processing time.
Copy this evaluation scorecard into Excel or Sheets
Use hard gates before the weighted score. An agent fails the test if imported rows do not reconcile, a material control total is wrong, or the output silently drops rejected rows.
| Criterion | Weight | Score rule (0–5) | Evidence required |
|---|---|---|---|
| Import integrity | Gate | 5 only when row/column counts reconcile; otherwise fail |
Import summary and rejected-row count |
| Material control totals | Gate | 5 only when all agreed totals match; otherwise fail |
Independent Excel calculation |
| Seeded issue recall | 20% | Issues found ÷ issues seeded | Exception table with source rows |
| False-positive control | 10% | 5 means no valid record was incorrectly changed |
Reviewer disposition log |
| Numerical correctness | 25% | Correct grouped metrics and formulas | Calculation fields, filters, and period |
| Repeatability | 15% | Same result on second run and renamed-column fixture | Run IDs, prompts, and output comparison |
| Reviewability and provenance | 20% | Values trace to rows, fields, formulas, or artifacts | Source references and unresolved list |
| Output usability | 10% | Reviewer can use the workbook/report after minor or no repair | Correction count and acceptance note |
Calculate the 100-point result as SUMPRODUCT(score, weight) / 5, after confirming both gates pass. Publish misses, failures, and “not tested” fields beside the score. A high score with a failed control total is still a failed evaluation.
For sensitive finance, payroll, legal, or employee-level data, do not use live personal data merely to test an agent. Use anonymized data where possible and assess private deployment for workflows that need controlled data boundaries.
Generic AI, workbook assistants, and RowSpeak
The products below should be compared by operating surface and deliverable, not by a single “AI quality” score.
| Option | Where the agent works | Strongest fit | Review surface | Evidence in this article | Important boundary to test |
|---|---|---|---|---|---|
| Microsoft Copilot in Excel | Inside a Microsoft 365 workbook | Formula help, workbook analysis, and edits when Excel remains the deliverable | Workbook formulas, tables, and change context | Vendor documentation only; not independently executed | Tenant/plan availability, workbook structure, and behavior on external file packages |
| Gemini in Google Sheets | Inside the Google Workspace workflow | Collaborative Sheets work, table creation, formulas, summaries, and Workspace context | Sheet cells, version history, and shared review | Vendor documentation only; not independently executed | Feature availability and whether the final business report must leave Sheets |
| ChatGPT data analysis | General chat with uploaded files | Fast exploration, code-assisted analysis, and prototypes | Conversation, generated tables, code, and downloadable artifacts | Vendor documentation only; not independently executed | Repeatability, file retention policy, and handoff into a governed reporting process |
| RowSpeak | File-based analysis and reporting workspace | Excel/CSV/PDF/image inputs that need answers, reports, or dashboards | Prompt, displayed analysis, downloadable artifacts, and report/dashboard output | Seven recorded workflow categories plus three visible failure cases | Mapping changes, ambiguous definitions, large-file behavior, and reviewer correction flow |
| BI platform | Governed model connected to business systems | Shared metrics, scheduled refresh, permissions, and broad dashboard distribution | Semantic model, refresh logs, lineage, and dashboard permissions | Category comparison only; no platform benchmark | Implementation effort and whether a small export-driven workflow justifies the model |
RowSpeak is useful when the business need is between workbook assistance and BI: a team has exported files, needs a repeatable analysis and reporting workflow, and wants outputs colleagues can review and share. Explore the spreadsheet assistant workflow for general file work, or the business reporting agent guide for a reporting-focused comparison.
For current capability details, start with the vendors’ own documentation: Microsoft Copilot in Excel, Gemini in Google Sheets, and the ChatGPT file uploads FAQ. Vendor pages describe availability and limits; they are not independent performance benchmarks.
Run a controlled first test
Start with the downloadable fixture above and write the expected result before running an agent:
- eight nonblank source records;
- two exact duplicate pairs (
1001and1002), leaving six unique rows if exact duplicates are removed; - dates expressed as dotted text, slash-formatted text, and date-like values;
- missing prices for orders
1003and1005; - missing statuses for orders
1003and1006; - inconsistent customer-name casing;
- one blank row that should not become a transaction.
Use this prompt:
Profile this workbook before changing it. Return source row count, exact duplicate
groups, date representations, and missing counts by column. Then create a new
workbook with exact duplicate rows removed, dates standardized to yyyy-mm-dd,
customer names standardized consistently, and missing values preserved unless a
rule is explicitly approved. Include a Changes sheet listing source row, field,
old value, new value, and rule. Reconcile output row count to the source.
Fail the run if the agent changes a missing price to zero, deletes a non-identical row that only shares an order ID, converts an ambiguous date without declaring a locale, or omits the change log. Then run the same prompt twice and compare row counts, mappings, changed cells, and control totals.
Only after the small fixture passes should you create 5 MB, 25 MB, and 50 MB variants. In this article, those large-file cross-vendor results remain not tested. Publishing that limitation is more trustworthy than inventing a Copilot-versus-RowSpeak response-time table.
The useful AI agent is not the one that claims to do everything. It is the one that completes the right part of your spreadsheet process with boundaries your team can trust.
If you want to evaluate the file-to-report category, run the fixture and scorecard above on a sanitized export in the RowSpeak spreadsheet assistant workflow. Keep the prompt, output, exception log, and reviewer decision together so the result can be audited before the workflow reaches production.