A monthly report should not begin with a hunt for the latest spreadsheet. It should begin with a workflow that tells your team which files to use, which numbers to check, and what the final report must answer.
That is the useful definition of AI Excel automation. It is not a prompt that changes cells without review. It is a repeatable process that turns recurring Excel and CSV exports into a checked report, dashboard, and action list.
This guide uses a simple finance-and-sales reporting example. You will see where fixed spreadsheet rules belong, where AI can help, and how to keep a person responsible for the final decision. It also includes recorded product evidence, visible failure modes, and a downloadable regression workbook rather than presenting a theoretical automation diagram as proof.
Key takeaways:
- Put calculations, required fields, period checks, and control totals in deterministic rules; use AI after those checks for variance explanations, chart options, and report drafting.
- A recurring report is ready to automate only when the team can name the source owner, row grain, KPI definition, exclusion rules, expected control total, and final reviewer for every input file.
- Treat a changed column name, partial month, duplicate correction, mixed currency, and late refund as normal test cases—not rare exceptions. The workflow should stop or create a review queue instead of silently guessing.
- Measure improvement across two cycles with import/reconciliation errors, reviewer corrections, and time to first usable draft. A faster first answer is not a win if the report needs more rework.
- In the recorded RowSpeak output, the dashboard artifact is usable for review but its headline
1.31Msales,43orders, and30.36Kaverage order value still need source reconciliation. Artifact creation and KPI approval are separate gates.
What reliable AI Excel automation means
Reliable automation has two parts. The first is deterministic work: date parsing, duplicate checks, formula logic, and required-field validation. The same input should produce the same result.
The second is interpretive work: explaining why margin moved, proposing a chart, grouping a long exception list, or drafting a management summary. AI can speed up that work, but it should not silently redefine a KPI or approve a financial result.
For example, a rule can flag a refund with a missing order ID. AI can then summarize whether missing IDs cluster in one region or channel. The first protects data quality. The second helps a manager decide what to investigate.
A practical monthly reporting example
Assume a sales operations team receives these files every month:
| File | Purpose | Required checks |
|---|---|---|
sales_export.xlsx |
Orders, revenue, region, channel | Dates, duplicates, currency, cancelled orders |
budget.xlsx |
Revenue and spend plan | Metric definitions and period alignment |
refunds.csv |
Refund reason and value | Missing order IDs, return timing, category labels |
The leadership team needs three outputs: a regional performance view, a budget-versus-actual explanation, and a short list of actions for the next month.
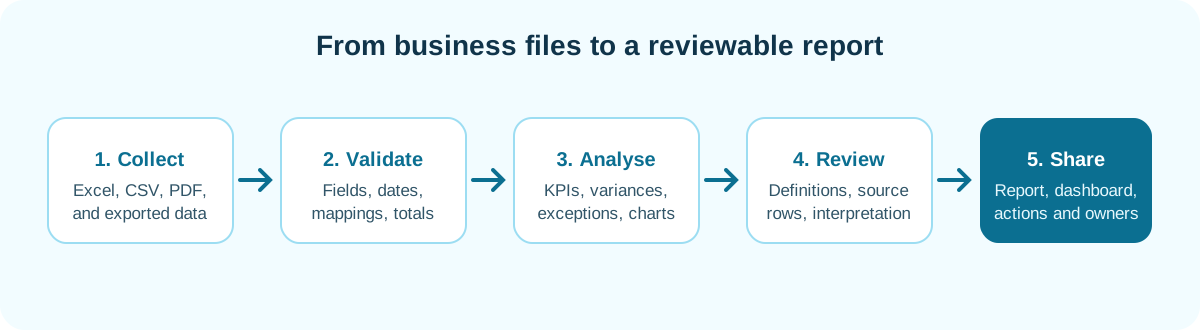
Instead of copying values between workbooks, define the workflow below.
What the product workflow looks like in practice
The following screenshots come from a recorded RowSpeak dashboard demonstration using SaleData.xlsx. The first screen shows the uploaded workbook and a concrete dashboard request focused on sales performance by region, product type, and representative.
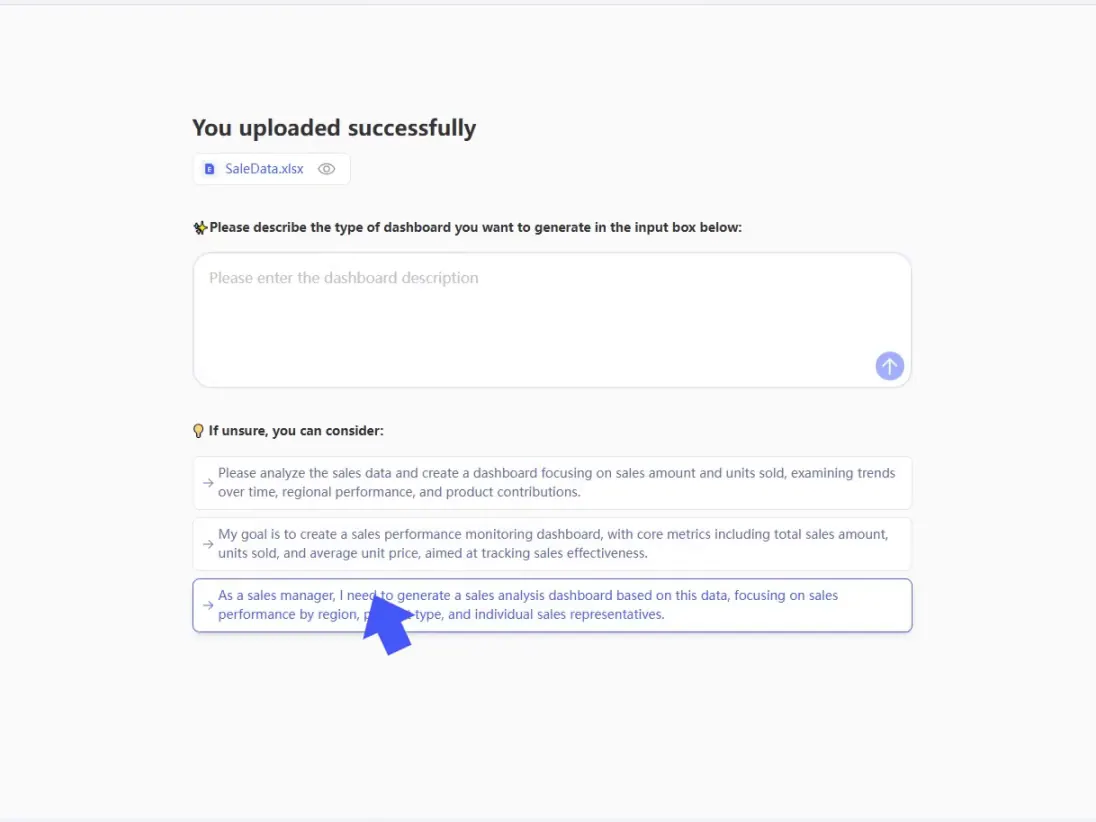
The generated dashboard includes filter controls, KPI cards, a product-mix visual, and written key insights.
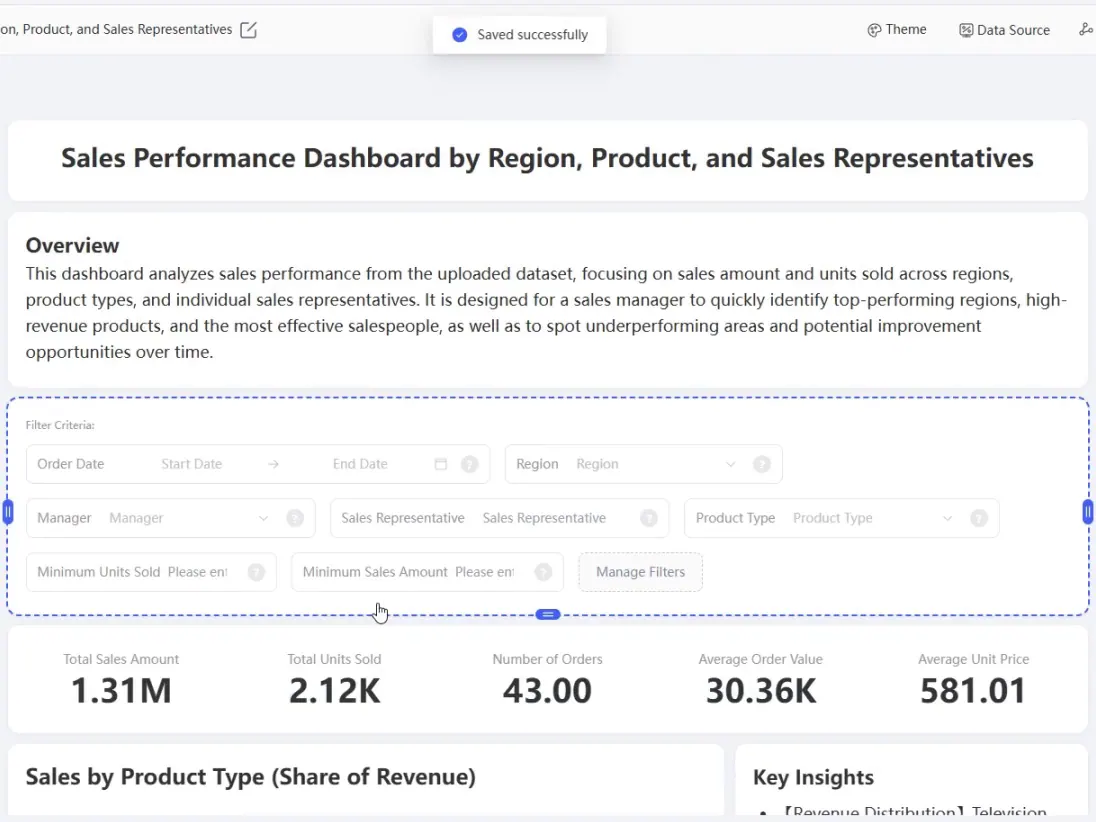
This demonstrates the file-to-dashboard path and the kind of artifact a manager can review. It does not prove that the KPI definitions are correct. In this example, a reviewer should still confirm whether “Total Sales Amount” is gross or net of returns, whether 43 means orders or distinct order IDs, and whether the average values use the intended denominator. Interface labels may also change after publication.
Observed execution ledger
The evidence below comes from repository-hosted RowSpeak demonstrations. Some recordings use the previous Excelmatic brand; Excelmatic is now RowSpeak. The ledger records what is visible and keeps missing validation visible rather than converting it into a favorable score.
| Reporting stage | Recorded evidence | Visible result | Failure or unresolved check | Verdict |
|---|---|---|---|---|
| File to dashboard | SaleData.xlsx dashboard run above |
Filters, five KPI cards, charts, and written insights | 1.31M, 43, and 30.36K are not tied to an independent source calculation in the recording |
Artifact pass; KPI approval pending |
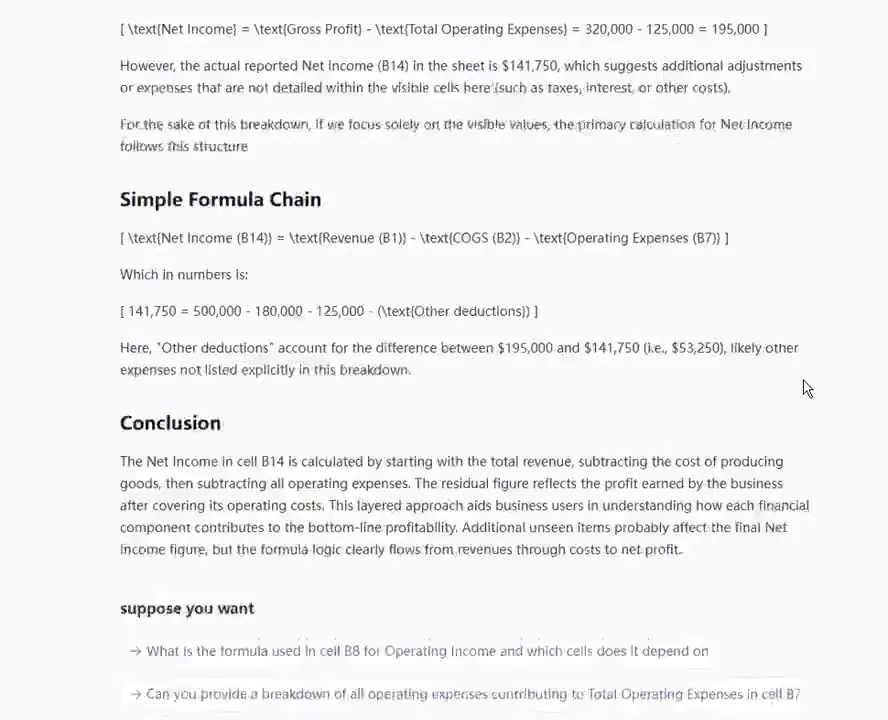
| Formula audit | Net-income review | Detects a visible 53,250 residual between components and reported net income |
Suggests “other deductions” without naming a source cell or dependency | Discrepancy pass; explanation fail |
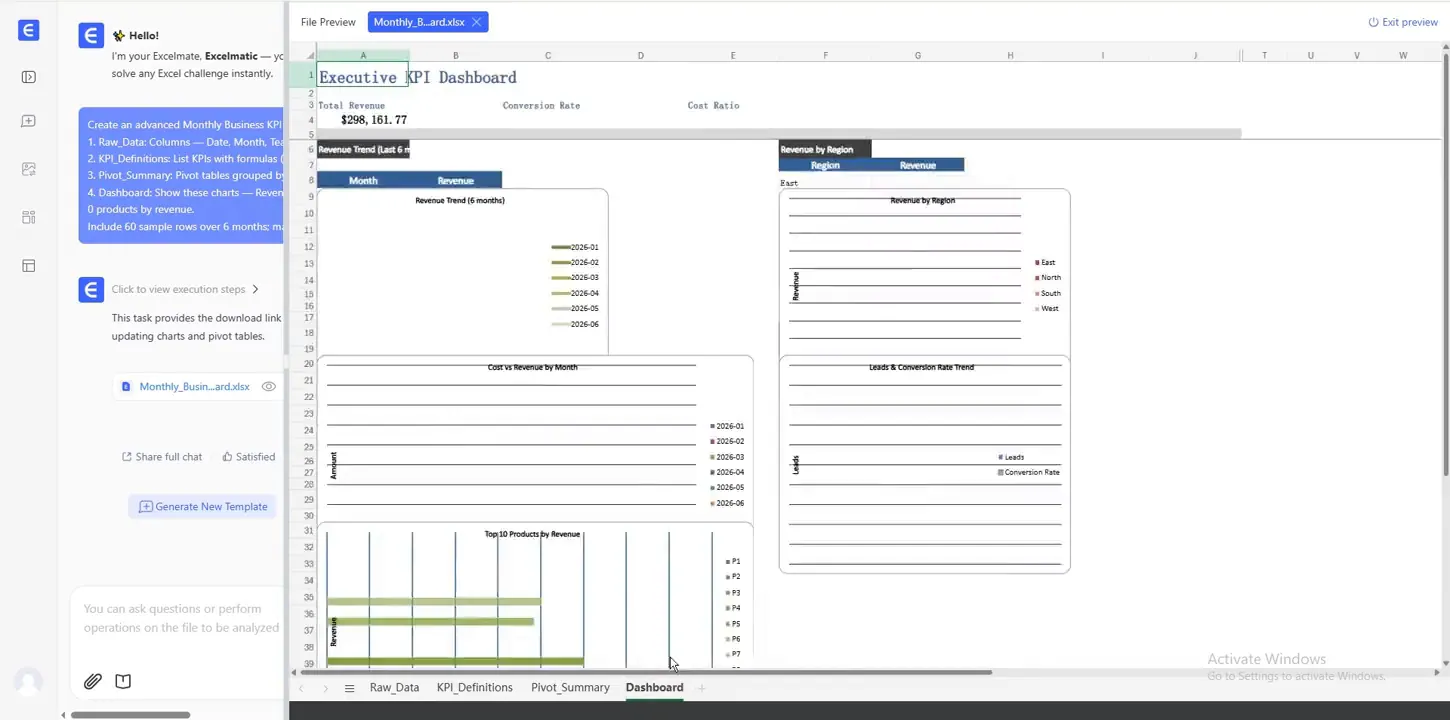
| Workbook generation | Four-sheet Excel output | Creates Raw_Data, KPI_Definitions, Pivot_Summary, and Dashboard |
Several chart areas appear empty or incomplete in the preview | File pass; presentation fail |
| Data cleaning | Duplicate and date-standardization sequence | Reduces the first visible table from eight nonblank rows to six after de-duplication | Dates remain a mix of text and serial values; later transformations are not proven to preserve de-duplication | Partial pass |
These are workflow observations, not a cross-vendor benchmark. No Copilot, Gemini, ChatGPT, or RowSpeak 50 MB timing comparison was independently executed for this article.
Step 1: Prepare a file contract
A file contract is a short checklist that makes recurring imports predictable. It should state the expected file name, reporting period, column names, currency, and source owner.
For the example above, define Order Date, Net Revenue, Refund Amount, Region, and Channel before analysing anything. If a file uses Sales Region instead of Region, correct that mapping before calculating a KPI.
This first step is often more valuable than a sophisticated prompt. A clean, agreed input reduces the chance that AI answers a well-written question against the wrong column.
Step 2: Separate business rules from AI requests
Use a small decision table when you design the automation.
| Job | Better handled by | Example |
|---|---|---|
| Required-field check | Rule | Flag records without an order date |
| Calculation | Formula or rule | Net revenue minus refunds |
| Threshold alert | Rule | Flag a refund rate above the agreed threshold |
| Pattern explanation | AI | Explain regions with the largest variance |
| Report draft | AI | Draft a five-bullet management summary |
This separation also makes corrections easier. If a variance is wrong, you know whether to inspect the formula, the mapping, or the AI interpretation.
Step 3: Build the reviewable analysis path
After the files pass basic checks, calculate the core measures first. For this example, use revenue, refund rate, gross margin if available, budget variance, and month-over-month change.
Then ask for interpretation with the calculation context included. A useful prompt is specific about both the output and the boundaries:
Using the validated monthly table, compare actual net revenue with budget by
region and channel. Identify the three largest absolute variances. For each,
show the current value, budget, variance percentage, and the rows or categories
that should be reviewed. Do not infer a cause when the file does not contain
evidence. Draft five plain-English bullets for the management report.
The important instruction is not the word “AI.” It is the requirement to show the values, name the comparison, and distinguish evidence from an interpretation.
Step 4: Turn analysis into a report, not just an answer
An answer in a chat window is rarely the final deliverable. Most teams need a format they can review with colleagues and use again next month.
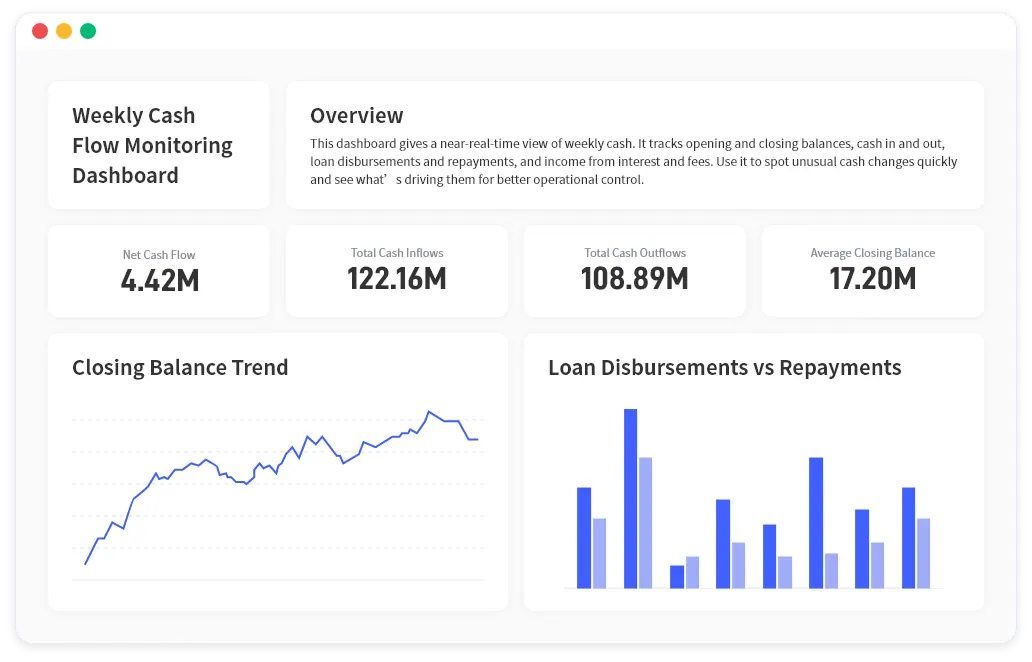
With an AI reporting workflow, you can move from the checked table to a written summary, supporting charts, and a consistent report structure. RowSpeak is useful when the workflow begins with real Excel, CSV, PDF, or image-based tables and ends with an output a manager can read and question.
For this report, keep the structure stable:
- Executive summary
- Revenue and budget variance
- Refund and margin exceptions
- Regional or channel charts
- Actions, owners, and open questions
Stable sections make recurring reports easier to compare. They also make it obvious when a month has insufficient data for a conclusion.
Step 5: Add a human review gate
Before sharing the report, review these points:
- Does the reporting period match across all files?
- Are currency, tax, and refund definitions consistent with the budget workbook?
- Do totals reconcile to the source export?
- Are large variances supported by data, rather than a plausible-sounding explanation?
- Is every action item assigned to a team or owner?
For sensitive finance, payroll, or employee data, use anonymized examples for exploration and follow your organisation's data-handling process. If you need controlled data boundaries and internal review, assess private deployment options before moving a sensitive reporting workflow.
The exception log reviewers actually need
A yes/no checklist is not enough when the source is messy. Save an exception log with the report:
| Exception | Why it changes the report | Safe handling |
|---|---|---|
| Sales file ends on the 29th but budget covers the full month | Creates a false unfavorable variance | Label the period partial or wait for the complete export |
| Refund arrives in July for a June order | Distorts both month-over-month revenue and refund rate | Apply the documented recognition rule and show the timing difference |
USD and CAD appear in one amount column |
Totals become meaningless | Convert with an approved rate table or split the report by currency |
| A corrected order reuses the original order ID | A simple de-duplication rule can remove the valid correction | Retain version/status fields and send the pair to review |
Region changes from EMEA to country-level labels |
Historical comparisons break | Maintain a dated mapping table instead of rewriting prior values |
| Formula cell is cached but its source sheet is missing | The displayed value cannot be reproduced | Mark it unresolved and request the source workbook |
The owner should resolve material exceptions before the narrative is drafted. Otherwise the AI may write a confident explanation for a variance created by the import itself.
Step 6: Make the workflow repeatable
The first useful automation is usually not a fully autonomous system. It is a documented sequence that the same owner can run again next month.
Save these items with the report:
- a data dictionary with the exact meaning of each KPI;
- the file contract and approved column mappings;
- the formula or rule used for every calculated measure;
- the prompt used to draft the narrative and chart requests;
- the exception thresholds and the person who reviews them;
- a short log of changes made this month.
For example, if the finance team changes the refund definition to exclude a new category, record the change in the report notes. Otherwise, next month's AI summary may compare two values that look similar but use different logic.
Download a regression workbook with known defects
Download Executive_Quickstart_Sample.xlsx and keep an untouched copy as a regression fixture. The workbook contains nine physical data rows after the header, including one entirely blank row, so the expected nonblank record count is eight.
Before running an automation, record these known conditions:
ORD-001appears twice as an exact duplicate;- dates mix dotted text such as
2023.10.12with Excel date values; - one status cell is blank;
- one profit value is negative (
-150), which is an exception but not automatically an error; - the blank row must not become a transaction;
- the output must retain the source identifier and show every changed value.
Use the same file for three runs: 1) profile only, 2) clean into a new workbook, and 3) produce a short management summary. Fail the workflow if the profile misses the duplicate, if the negative profit is silently changed, if a missing status becomes a fabricated business state, or if the cleaned output cannot reconcile to seven unique nonblank records.
The clip below shows a recorded prompt-to-cleaned-workbook interaction. It is evidence that the interaction and downloadable-artifact path exist; the edited 10-second clip is not a server-response-time benchmark.
A 30-day implementation path
Week 1: map the manual work. List every file, formula, copy-paste step, chart, and approval in the current report. Do not automate yet; find the steps that recur.
Week 2: stabilize inputs. Create the file contract, confirm metric definitions, and build a small exception table. Make sure a second analyst can reproduce the existing report from the documented inputs.
Week 3: add AI to interpretation. Use AI to draft the variance summary, create a candidate chart set, and group exceptions. Compare each output with the prior manual report.
Week 4: publish the repeatable workflow. Agree on the final output template, review gate, and ownership. Then run the next reporting cycle with the workflow rather than a new ad hoc prompt.
This path prevents a common failure: automating visible formatting before the underlying data and review process are reliable.
Measure the improvement without inventing a success metric
You do not need to claim that AI saved a fixed percentage of time. Instead, record practical before-and-after measures for two reporting cycles:
- number of manual file merges;
- number of exceptions found before the report was sent;
- elapsed time from final source export to first reviewable draft;
- number of report sections that needed rework after review;
- whether the team could explain the largest variance from documented evidence.
Those measures tell you whether the workflow is becoming more dependable. Faster delivery is valuable only when the report remains accurate and reviewable.
Common automation mistakes
Automating a broken process. If each region calculates revenue differently, automation only distributes the disagreement faster. Agree on definitions first.
Using AI as a calculator of record. Keep repeatable calculations visible in formulas, rules, or documented transformations. Ask AI to explain the result after those checks run.
Skipping exception review. A summary can be accurate while hiding a few records that materially change a decision. Review exceptions, not only totals.
Treating a dashboard as the end. A dashboard should lead to a decision, owner, or follow-up. If it does not, reduce the number of charts and make the next action clearer.
Testing only the happy path. A clean 500-row sample says little about a month with a renamed column, a late correction, or an incomplete export. Keep a regression fixture with known defects and rerun it whenever the workflow or prompt changes.
Reporting speed without reconciliation. “Generated in 30 seconds” is not meaningful unless imported row counts and control totals match. Record both speed and correctness, including failed attempts.
Start with one recurring export
You do not need to automate every workbook at once. Start with the monthly or weekly export that creates the most manual copying, checking, and explanation. Define the file contract, the KPI rules, and the report sections. Then use an Excel AI workflow to turn the checked files into a report your team can review and improve.
The goal is not an unattended spreadsheet. It is a dependable reporting process that gives people more time to interpret the numbers and act on them.