If your weekly reporting starts with three files named meta_export_final.csv, google_ads_new.csv, and orders_latest.xlsx, you do not have a reporting problem because you lack charts. You have one because the files do not yet agree on what happened.
A useful Facebook Ads report needs to answer more than, “What did Meta say?” It needs to show what was spent, which campaign moved, what the platform attributed, what the order system recorded, and what a marketer should do next. That takes a small amount of data discipline before it takes a dashboard.
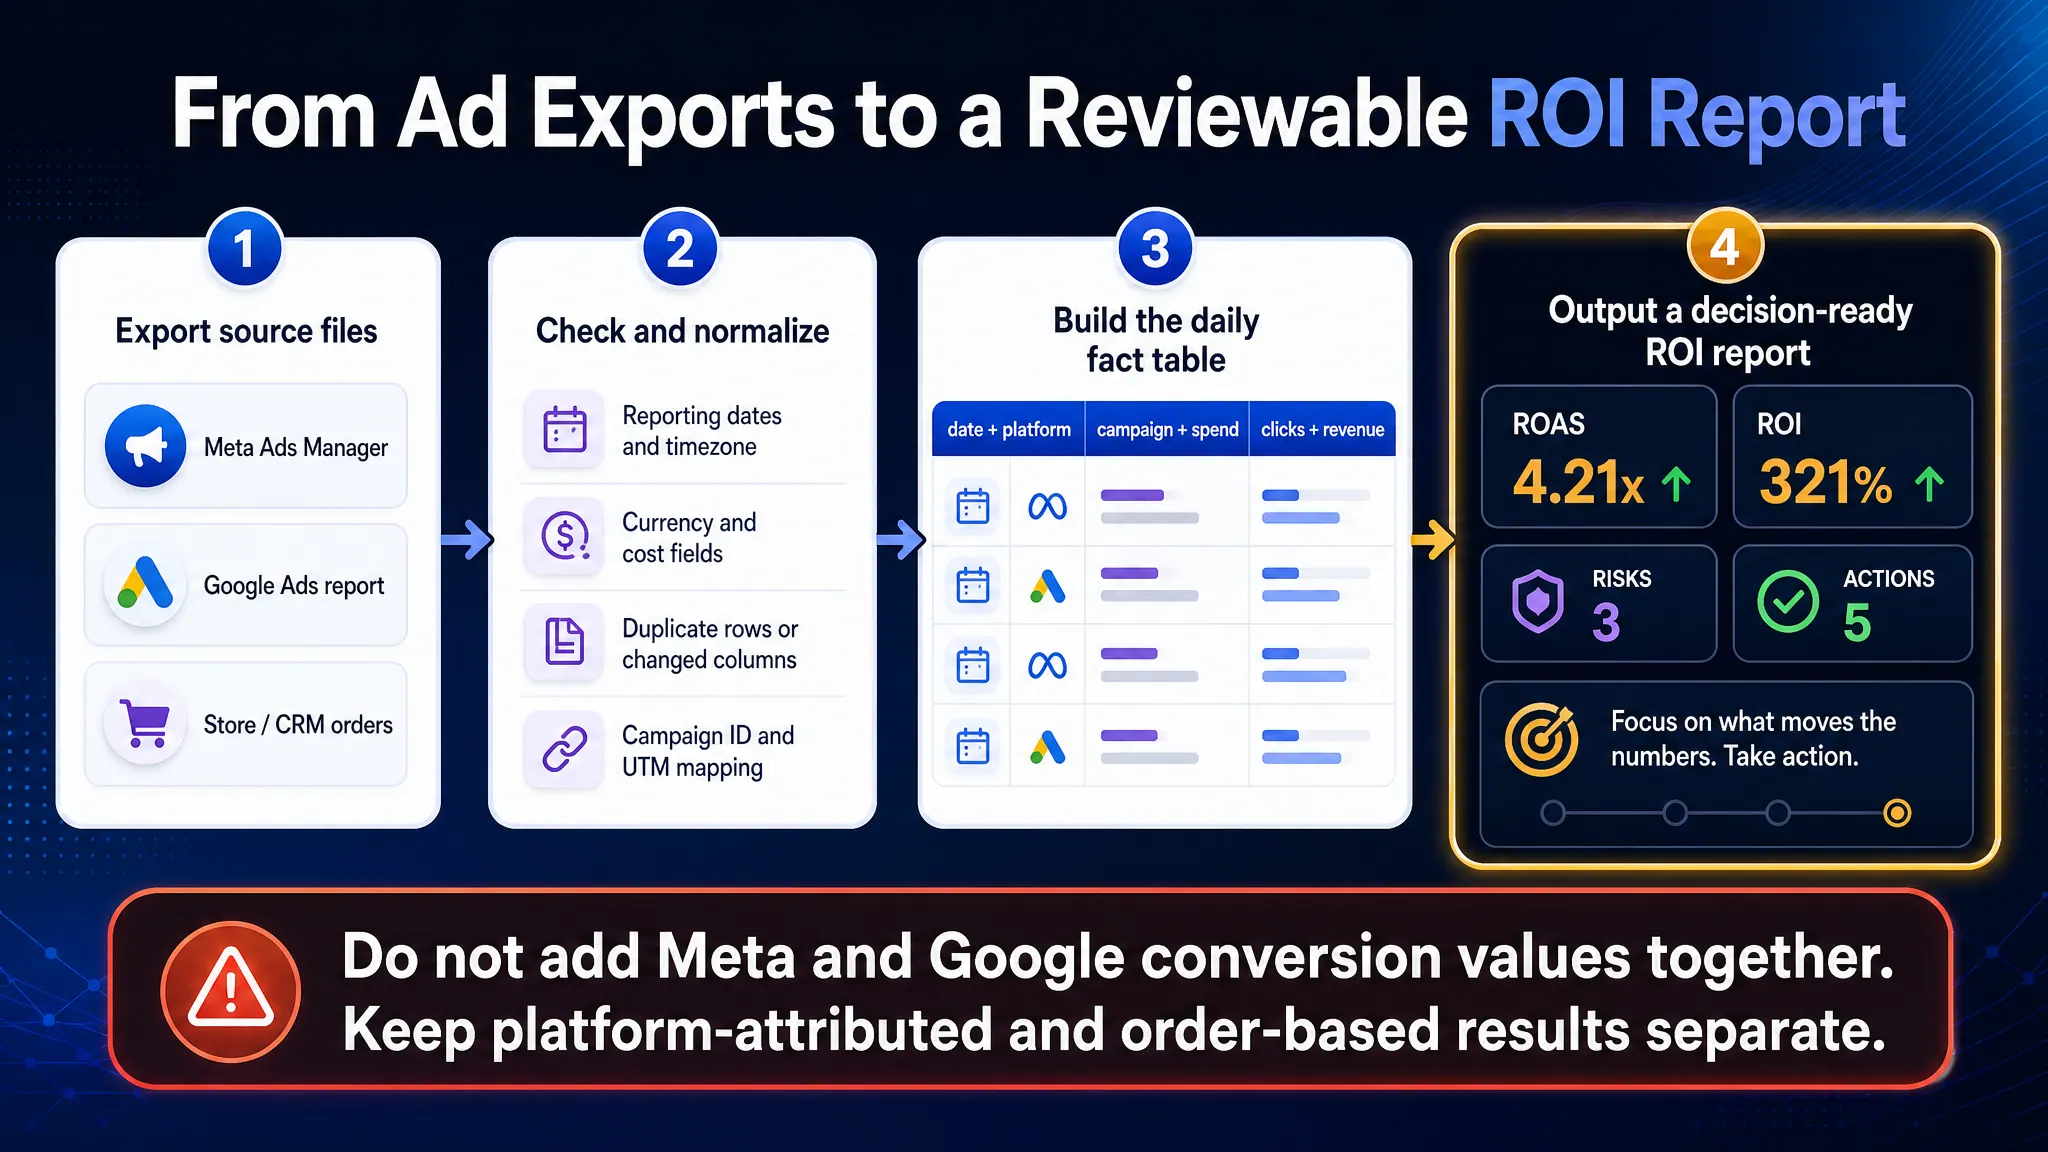
This guide shows how to turn Facebook Ads, Google Ads, and order exports into a reviewable campaign ROI report. You will get a copy-ready workbook structure, a field list, formulas, quality checks, and prompts you can use with RowSpeak. The workflow is designed for marketers and agencies that work from CSV and Excel exports—not teams ready to build a data warehouse.
Key takeaways:
- A Facebook Ads export is a source file, not a finished report. Start with one clear reporting grain—usually one row per campaign per day—before adding charts or calculating ROI.
- Keep platform-attributed ROAS separate from order-based ROI. Meta and Google can both claim credit for the same sale; their conversion values should not be added together as if they were separate orders.
- Google Ads scheduled reports reduce repetitive downloading, but they do not reconcile Meta, refunds, costs, or campaign naming. A repeatable data model and review step are still required.
- RowSpeak is useful after you export the files: it can inspect messy columns, surface exceptions, analyze campaign movement, and turn a checked table into a shareable report or dashboard.
What a campaign report should help you decide
Most teams do not need a report with every available advertising metric. They need a report that helps them decide whether to scale, hold, fix, or pause a campaign.
For example, a growth marketer may need to answer these questions on Monday morning:
- Which campaigns used more budget than last week, and did the additional spend produce an acceptable result?
- Is a lower ROAS a real problem, a conversion-lag issue, or a tracking mismatch?
- Did net revenue fall because of weaker demand, more refunds, a naming change, or an incomplete export?
- Which result is based on Meta or Google attribution, and which result is based on orders in the store or CRM?
That last question matters. A Meta report can be correct according to Meta’s selected attribution setting. A Google Ads report can also be correct according to Google Ads. Yet the two platform conversion values may both include credit for the same customer order. A cross-channel report becomes misleading when it silently adds those values together.
The workflow below prevents that mistake. It creates two clearly labelled views:
- Platform performance view for optimizing inside Meta or Google: spend, impressions, clicks, platform conversions, and platform-attributed conversion value.
- Business outcome view for evaluating profitability: reconciled orders, net revenue, refunds, cost of goods sold (COGS), fulfilment or payment costs, and allocated operating costs where available.
Step 0: Define the report before you export anything
The most expensive reporting mistake is to start with downloads and decide the rules later. Before opening Ads Manager, write a short README tab or note with the definitions below.
| Definition | Recommended decision rule |
|---|---|
| Reporting period | Use completed calendar days in the ad account timezone. Label the period and the extraction date. |
| Reporting grain | Use one row per date + platform + ad account + campaign ID for the main table. |
| Click metric | Choose one click definition, such as link clicks or outbound clicks. Do not compare different click types as though they are identical. |
| Platform conversion value | Keep the value reported by Meta or Google, alongside its attribution setting. |
| Net revenue | Define whether it excludes cancelled orders, discounts, refunds, tax, shipping, or all of these. |
| ROI | State exactly which costs are included. Never call a simple revenue-to-spend ratio “profit ROI.” |
For an ecommerce brand, an order-based campaign ROI can be defined as:
Campaign ROI =
(attributed net revenue − COGS − fulfilment/payment costs − ad spend − allocated operating costs)
÷ (ad spend + allocated operating costs)
This is not the same as ROAS:
ROAS = attributed revenue ÷ ad spend
ROAS can be enough for an in-platform bidding decision. ROI is the more useful figure when you need to know whether a campaign contributes profit after the costs your business actually bears.
If you cannot credibly map orders to campaigns, do not invent an order-based campaign ROI. Report platform ROAS by campaign, then report a separate blended business view for the period. Honest uncertainty is better than a precise-looking number with no defensible source.
Step 1: Export Facebook Ads data at the right grain
Meta’s interface changes over time, so use the current guidance in the Meta Business Help Center for the exact menu labels. The reporting principle is stable: configure the date range and reporting level first, customize the columns second, and export only the fields you can explain.
For the primary report, create a campaign-level, daily export. A useful minimum field set is below.
| Group | Fields to export | Why the field matters |
|---|---|---|
| Identity | Account ID/name, campaign ID, campaign name, campaign objective, delivery status | IDs remain useful when a campaign is renamed; names remain useful for people reviewing the report. |
| Time | Day or reporting start/end date, account timezone recorded in README | A monthly total is hard to check without the daily rows behind it. |
| Delivery | Spend, impressions, link clicks or outbound clicks | These drive CPM, CTR, and CPC. Use the same click definition throughout the report. |
| Platform result | Purchases/leads, cost per result, purchase conversion value or value of the selected result | Keep these as Meta-attributed values, not as confirmed store revenue. |
| Context | Attribution setting, currency, export timestamp | These explain differences when results change after an attribution window or currency conversion. |
Keep breakdown exports separate
Do not put every breakdown into one “master” campaign export. A placement breakdown can produce several rows for one campaign-day. Age, gender, device, or region breakdowns do the same. If you append that file to a campaign-level table and sum spend, impressions, or conversions, you can double-count or multiply the totals.
Use separate source tabs or files instead:
Meta_Campaign_Daily_Rawfor the main campaign report;Meta_Placement_Rawfor placement optimization;Meta_Audience_Rawfor demographic analysis.
Only compare a breakdown file with its matching reporting grain. This one rule prevents a surprising number of “why does the dashboard not match Ads Manager?” conversations.
Do not sum reach across days
Reach is useful for understanding delivery, but a person reached on three days can appear in the three daily reach values. Treat daily reach as a delivery signal, not a period total you can safely add. If you need period-level unique reach, use the platform’s period-level number and label it as such.
Step 2: Set up a Google Ads automated report—but understand its boundary
Google Ads can save and schedule reports. That is useful when the same report must arrive each week, but scheduled delivery is not a cross-channel reporting system. Follow the current Google Ads report editor and scheduling guidance to save a campaign report and send it to the appropriate reporting inbox or destination.
Set up the Google Ads report at the same grain as the Meta export: campaign per day. Include:
- Date
- Customer ID and customer name
- Campaign ID and campaign name
- Campaign status and campaign type
- Cost, impressions, and clicks
- Conversions and conversion value
- Conversion action, when the team needs to distinguish purchase, lead, call, or offline conversion
- Account currency and account timezone in the README
Use the scheduled Google file as Google_Campaign_Daily_Raw. Keep it unchanged after it arrives. If a column must be cleaned or renamed, do that in a separate mapping or calculation layer.
What “automatic” does and does not mean
Google Ads automation can deliver the platform’s report on a cadence. It does not automatically:
- make Meta and Google attribution comparable;
- remove test orders, cancellations, or refunds;
- know that
Summer Sale | Prospectingwas renamed toSS26-PROS; - allocate COGS, agency fees, or payment fees;
- validate that the export includes every day in the reporting period;
- decide whether a campaign should be scaled.
Those are data-model and business-review tasks. Automation helps most after the definitions and checks are stable.
Step 3: Export the order or CRM data that makes ROI possible
Ad platforms explain what they delivered and attributed. Your store, subscription platform, CRM, or finance system explains what the business recorded. Export an order-level or customer-level table when you want to move beyond platform ROAS.
At minimum, aim for these fields:
| Field | Use in the report |
|---|---|
| Order ID or transaction ID | Finds duplicates and supports refunds or cancellations. |
| Order created date and completed/paid date | Makes the revenue timing rule visible. |
| Currency and gross sales | Supports normalization when the ad account and order system differ. |
| Discounts, refunds, cancellations | Converts gross sales into the agreed net-revenue definition. |
| Product or product margin / COGS | Supports contribution profit when the data is available. |
utm_source, utm_medium, utm_campaign, click IDs, or CRM campaign fields |
Creates the evidence needed to assign an order to a campaign. |
Do not join ad data to order data on campaign name alone. Campaign names are edited, copied, truncated, and sometimes reused. Instead, use a controlled campaign mapping table. A practical mapping table contains:
| Source platform | Source campaign key | Canonical campaign ID | Reporting campaign name | Valid from | Valid to | Mapping note |
|---|---|---|---|---|---|---|
| Meta | meta_120045... |
SS26_PROSPECTING |
Summer Sale – Prospecting | 2026-06-01 | 2026-06-30 | UTM campaign slug used at checkout |
ga_9988... |
SS26_BRAND |
Summer Sale – Brand Search | 2026-06-01 | 2026-06-30 | Google campaign renamed on June 16 |
The canonical ID is your reporting key. The source campaign key tells a reviewer where the number came from. The validity dates prevent a renamed campaign from being assigned to the wrong period.
Step 4: Use a five-layer campaign ROI template
The following structure is the campaign ROI template. It works in Excel, Google Sheets, or a spreadsheet-first workflow in RowSpeak. Keep raw source data intact; this makes the report easier to update and easier to audit when a stakeholder asks where a figure came from.
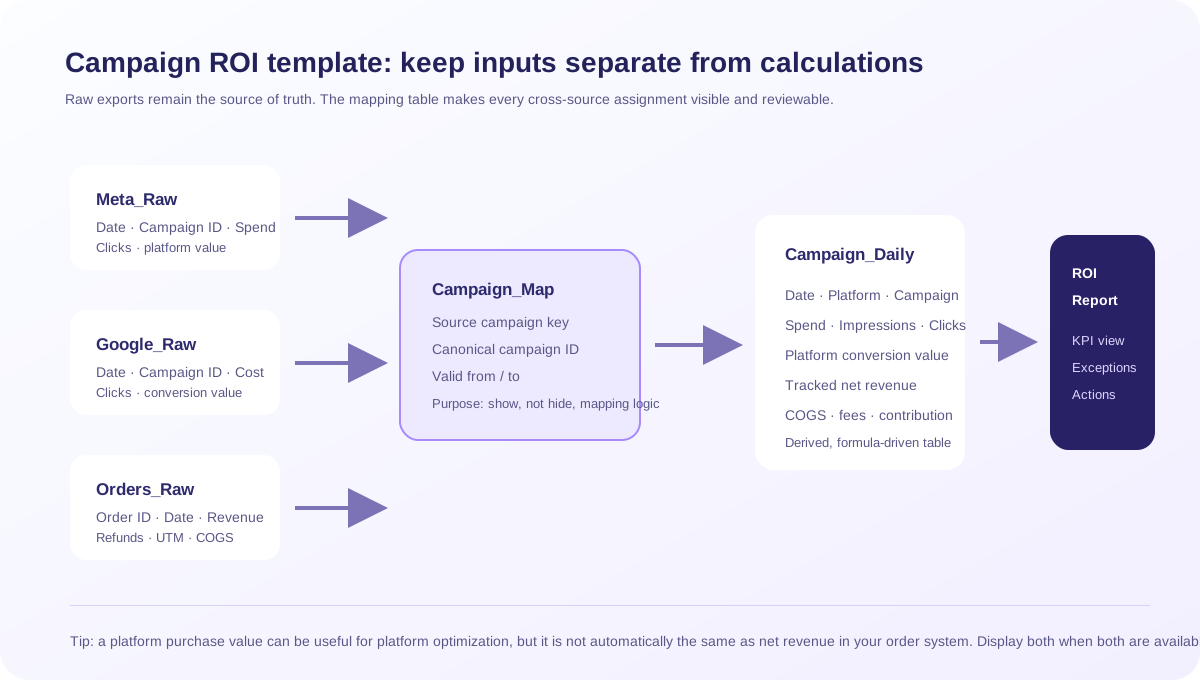
| Tab | What belongs there | Rule |
|---|---|---|
README |
Period, timezone, currency, metric definitions, attribution settings, extraction date, known limitations | Update it before publishing the report. |
Meta_Raw |
Unchanged campaign-level Meta export | Do not mix in placement or audience breakdowns. |
Google_Raw |
Unchanged campaign-level Google Ads export | Preserve the scheduled export date and source. |
Orders_Raw |
Unchanged order or CRM export | Keep IDs and refunded/cancelled status. |
Campaign_Map |
Source keys, canonical campaign ID, validity dates, notes | Make manual mapping visible. |
Campaign_Daily |
Formula-driven daily table with normalized columns | This is the only table used for repeated campaign calculations. |
ROI_Report |
KPI cards, campaign ranking, exceptions, and recommendations | Link every total back to Campaign_Daily. |
The normalized Campaign_Daily columns
Use these columns in the derived table. Leave a value blank when it is unknown. A zero means you know the value was zero; a blank means you do not have a reliable value.
| Column | Definition |
|---|---|
report_date |
Date in the agreed reporting timezone |
platform |
Meta or Google Ads |
account_id |
Platform account/customer ID |
campaign_id and campaign_name |
Source identity fields |
canonical_campaign_id |
Stable ID from Campaign_Map |
spend, impressions, link_clicks |
Platform delivery metrics |
platform_conversions, platform_conversion_value |
Results reported by the platform; never silently merge across platforms |
tracked_gross_revenue, refunds, tracked_net_revenue |
Order-system values assigned through documented tracking or mapping |
cogs, variable_fees, allocated_operating_costs |
Profit inputs, when available |
contribution_profit, platform_roas, tracked_roas, campaign_roi |
Formula-driven report metrics |
Formula examples
If you use an Excel Table named Campaign_Daily, these formulas are clear enough for a reviewer to inspect:
CTR
=IFERROR([@[Link Clicks]]/[@Impressions],"")
CPC
=IFERROR([@Spend]/[@[Link Clicks]],"")
Platform ROAS
=IFERROR([@[Platform Conversion Value]]/[@Spend],"")
Tracked Net Revenue
=[@[Tracked Gross Revenue]]-[@Refunds]
Contribution Profit
=[@[Tracked Net Revenue]]-[@COGS]-[@[Variable Fees]]
Campaign ROI
=IFERROR(([@[Contribution Profit]]-[@Spend]-[@[Allocated Operating Costs]])/([@Spend]+[@[Allocated Operating Costs]]),"")
Use a Not mapped status rather than forcing unmatched orders into a campaign. The unmatched percentage is itself a useful reporting metric: it tells the team how much confidence to place in campaign-level ROI.
Step 5: Reconcile before you interpret
Run this checklist before you share a weekly or monthly report. It takes less time than defending a wrong number later.
- Date coverage: Does each source include every expected completed day? Are partial today/yesterday values excluded or labelled?
- Source totals: Does Meta spend in
Meta_Rawmatch Meta’s period total? Does the same check pass for Google? - Grain check: Is the report based on campaign-day rows? Did a placement or audience breakdown enter the main summary by mistake?
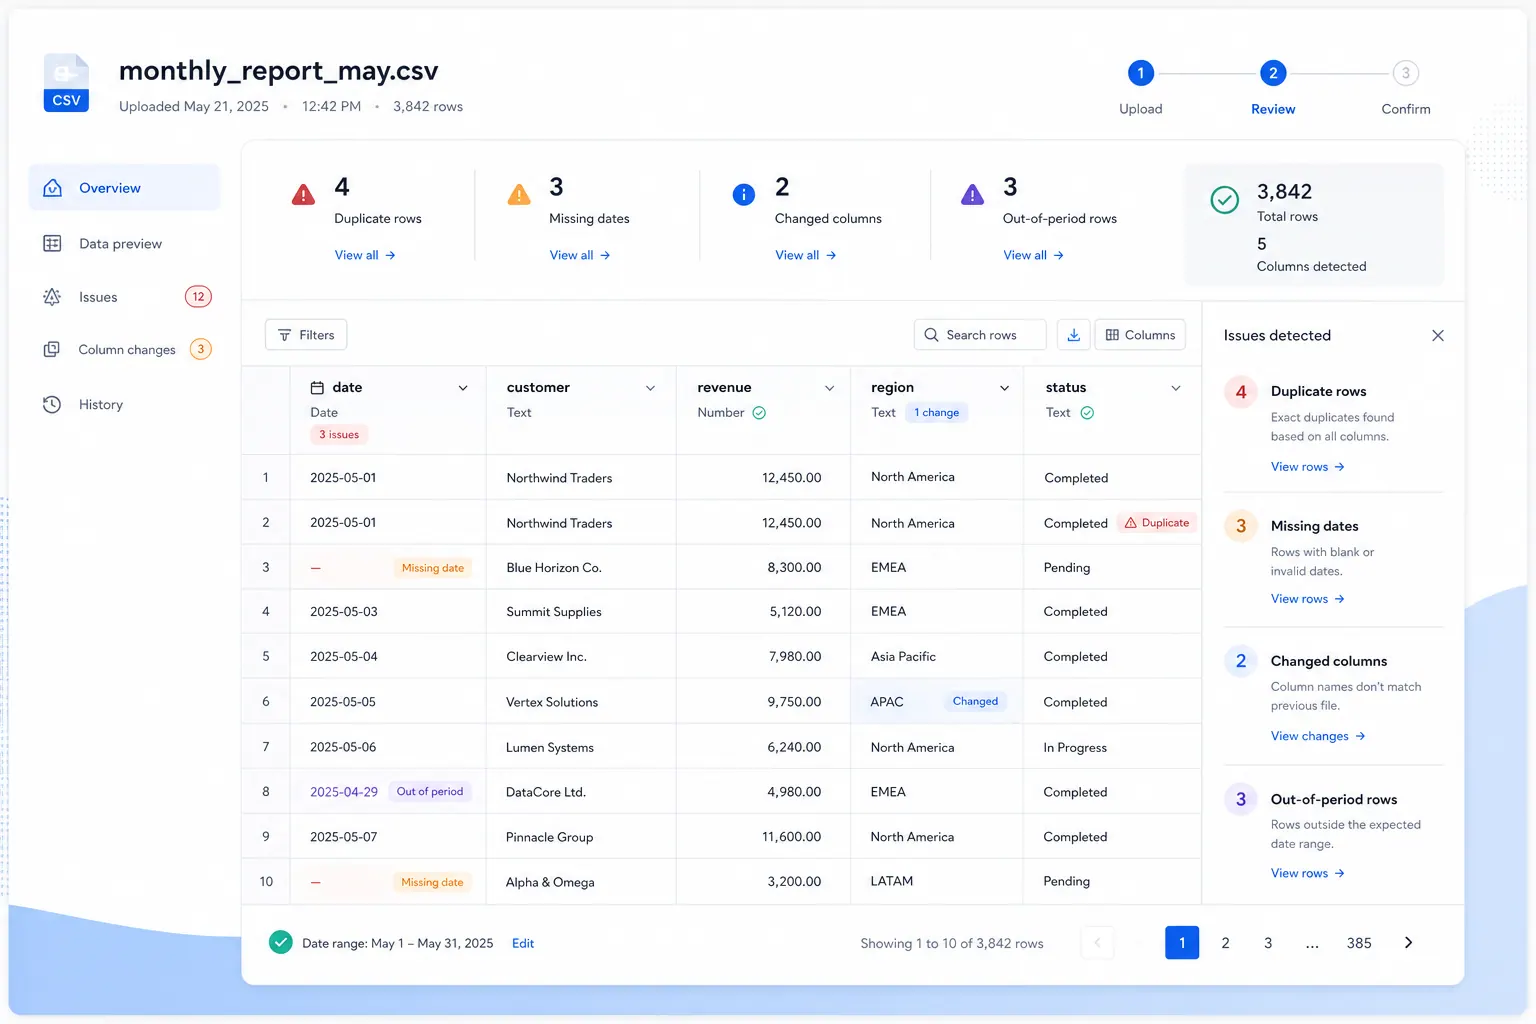
- Duplicates: Are there duplicate source rows, duplicated order IDs, or duplicated daily campaign keys?
- Timezone: Do ad-platform and order dates use the same business-day boundary? If not, document the conversion rule.
- Currency: Are spend and order revenue in the same currency before calculating ROAS or ROI?
- Attribution status: Is each platform conversion value labelled with its setting? Are order-based values presented separately?
- Refund lag: Does the report include refunds recorded after the sale? State the cutoff date.
- Campaign mapping: What percentage of spend and tracked revenue maps to a canonical campaign ID? Review any material
Not mappedgroup. - Reasonableness: Do period totals reconcile to a business-level revenue and spend view? If not, explain the difference instead of hiding it.
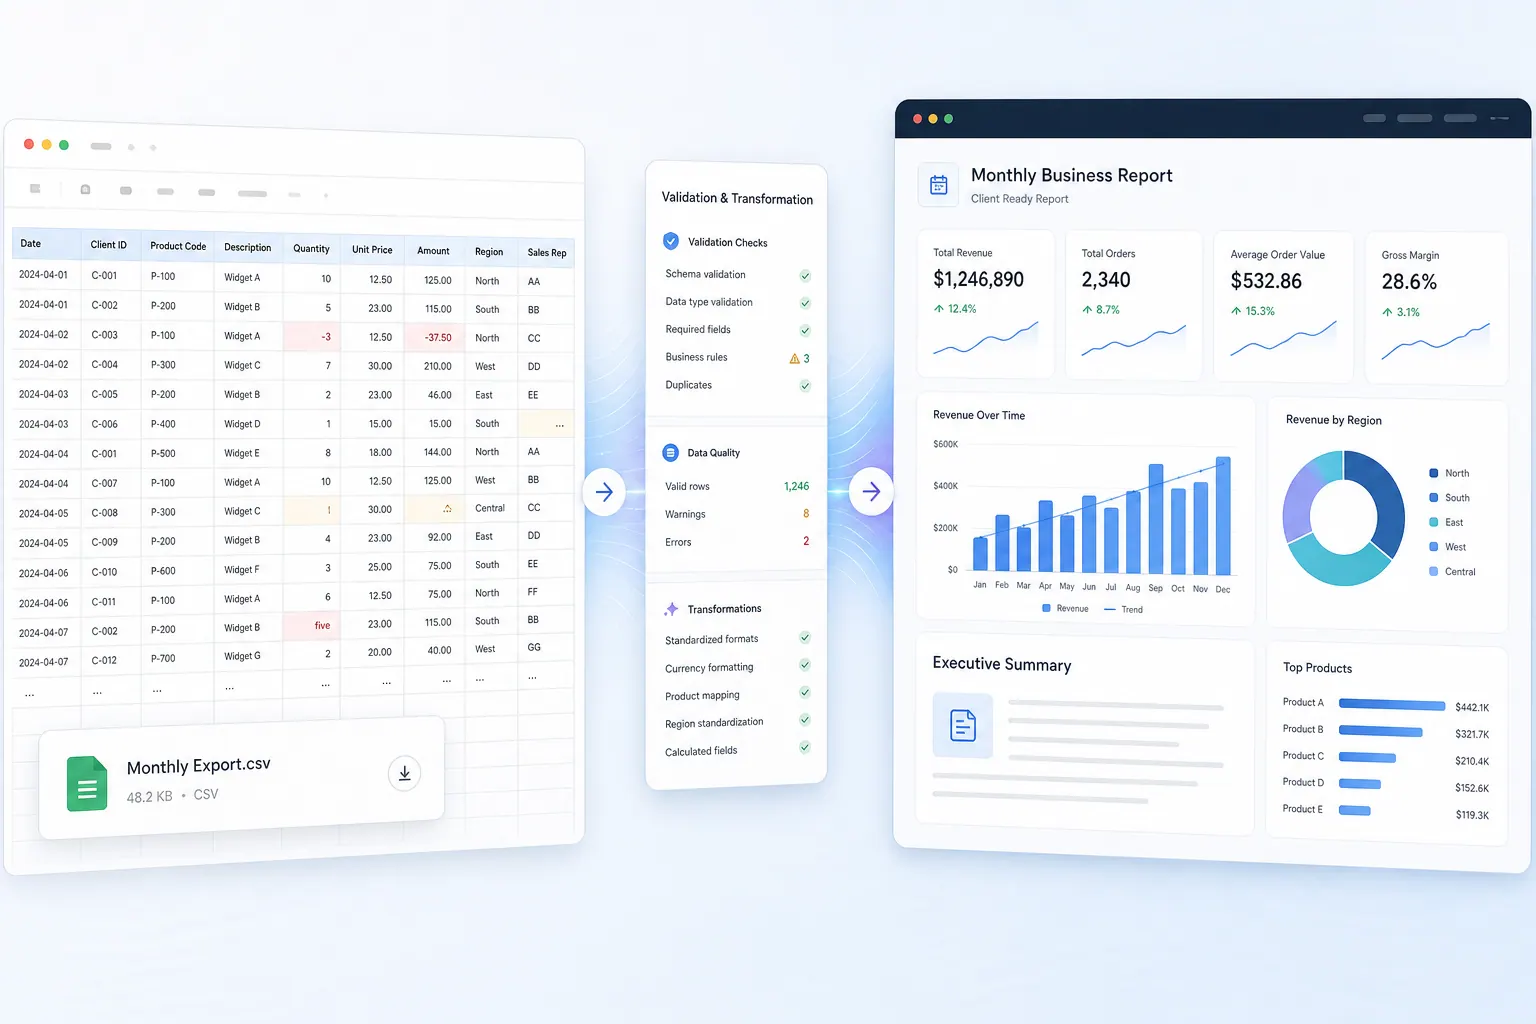
The data-quality view below is a useful model for the first review pass: look for duplicate rows, missing dates, unexpected changed columns, and records outside the period before you calculate any KPI.
Step 6: Turn the checked table into an analysis, not just a dashboard
After the checks pass, ask questions that connect movement to a possible action. A campaign table sorted by ROAS is not yet a report.
Start with four decisions:
| Decision | Evidence to review before making it |
|---|---|
| Scale | Enough spend and conversion maturity; tracked or platform result is above the agreed threshold; no material tracking warning. |
| Hold | Result is close to target, the period is still immature, or a creative/audience test needs more evidence. |
| Fix | Delivery or clicks are healthy but downstream conversion, checkout completion, offer, landing page, or tracking is weak. |
| Pause or reduce | The campaign is below the defined threshold after an adequate observation window, and no strategic reason justifies the spend. |
Use the platform view for delivery and creative diagnostics. Use the order-based view for business economics. The two views should lead to a better question, not a forced single “truth” number.
For example, a Meta campaign can have weak platform ROAS but acceptable order-based net revenue, perhaps because the platform’s setting does not match the store’s reporting window. The opposite can happen too: strong platform value but weak confirmed net revenue after refunds. The report should show the gap and name the next validation step.
Step 7: Use RowSpeak after the file rules are clear
You do not need to rebuild the same pivots, exception list, and written summary from scratch every month. After exporting the files and maintaining the mapping table, use a spreadsheet analysis workflow to inspect the structure and draft a report from the checked inputs.
Start with an inspection prompt:
Inspect the attached Meta, Google Ads, orders, and campaign-mapping files.
Do not calculate ROI yet. Identify each table’s grain, date coverage, currency,
duplicate keys, missing campaign mappings, changed column names, and any fields
that would make campaign-level revenue unreliable. Return a data-quality report
with the exact rows or groups that need review.
Then use a reporting prompt that keeps attribution definitions visible:
Using the approved metric definitions in README, create a weekly campaign report.
Show two separate views:
1. Platform performance: spend, impressions, link clicks, platform conversions,
platform conversion value, and platform ROAS by campaign.
2. Order-based economics: mapped gross revenue, refunds, net revenue, COGS,
variable fees, contribution profit, and campaign ROI by campaign.
Do not add conversion values from Meta and Google together. Flag incomplete days,
unmapped revenue, low-sample campaigns, and any conclusion affected by data quality.
End with scale, hold, fix, or reduce recommendations and the evidence for each.
The first prompt makes the assistant act like a reviewer. The second turns verified inputs into a decision-ready output. This is where an AI reporting workflow is more useful than a generic chat summary: the work stays connected to actual files, correction steps, and an output your team can review.
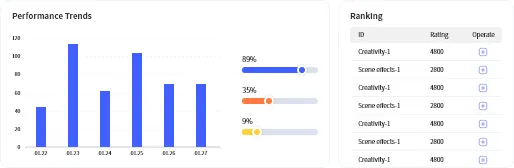
If the report needs a recurring visual view, add a KPI section for total spend, mapped net revenue, platform ROAS, tracked ROAS, ROI, and mapping coverage. Then add a trend chart, a campaign ranking, and a short exceptions table. This is usually enough for a weekly meeting; a heavier BI build makes sense later when sources, definitions, and sharing needs are stable.
For a broader file-to-report method, see the monthly CSV reporting workflow. For teams that want to turn the approved table into a visual view, the Excel-to-dashboard workflow is the natural next step.
Watch the campaign ROI reporting workflow
See how the checked campaign data becomes a reviewable ROI report with clear performance signals, exceptions, and recommended actions.
Frequently asked questions
Is Facebook Ads ROAS the same as campaign ROI?
No. Facebook Ads ROAS usually divides Meta-attributed conversion value by ad spend. Campaign ROI should account for the profit definition your business uses, including items such as refunds, COGS, variable fees, ad spend, and allocated operating costs. Use the terms precisely in the report.
Why do Meta, Google Ads, and store revenue not match?
They may use different attribution models, reporting windows, timezones, conversion definitions, currencies, and refund treatment. The goal is not to force every number to match. The goal is to label each view, reconcile what can be reconciled, and explain material differences.
Can I use the same template for lead generation?
Yes, but replace revenue and COGS with the business outcome you can verify, such as qualified leads, accepted opportunities, pipeline value, or closed-won revenue. Do not call a cost-per-lead table ROI if the lead-to-revenue link is unknown.
When should I move this workflow into a BI platform?
Move when sources, metric definitions, refresh logic, and the stakeholder audience are stable enough to justify governed connections and a maintained data model. If exports and questions change often, an AI-assisted spreadsheet workflow can remain faster and easier to review.
Turn the next export into a report your team can trust
The fastest path to a better Facebook Ads report is not another dashboard screenshot. It is a repeatable process: export at the right grain, state the metric definitions, preserve the raw files, make campaign mapping visible, reconcile the result, and separate platform attribution from business economics.
Try RowSpeak with a non-sensitive export from your next reporting cycle. Start with the inspection prompt, correct the exceptions it surfaces, then create the report and dashboard from the approved table. Explore RowSpeak’s marketing analytics workflow to turn messy campaign files into a reviewable reporting process.