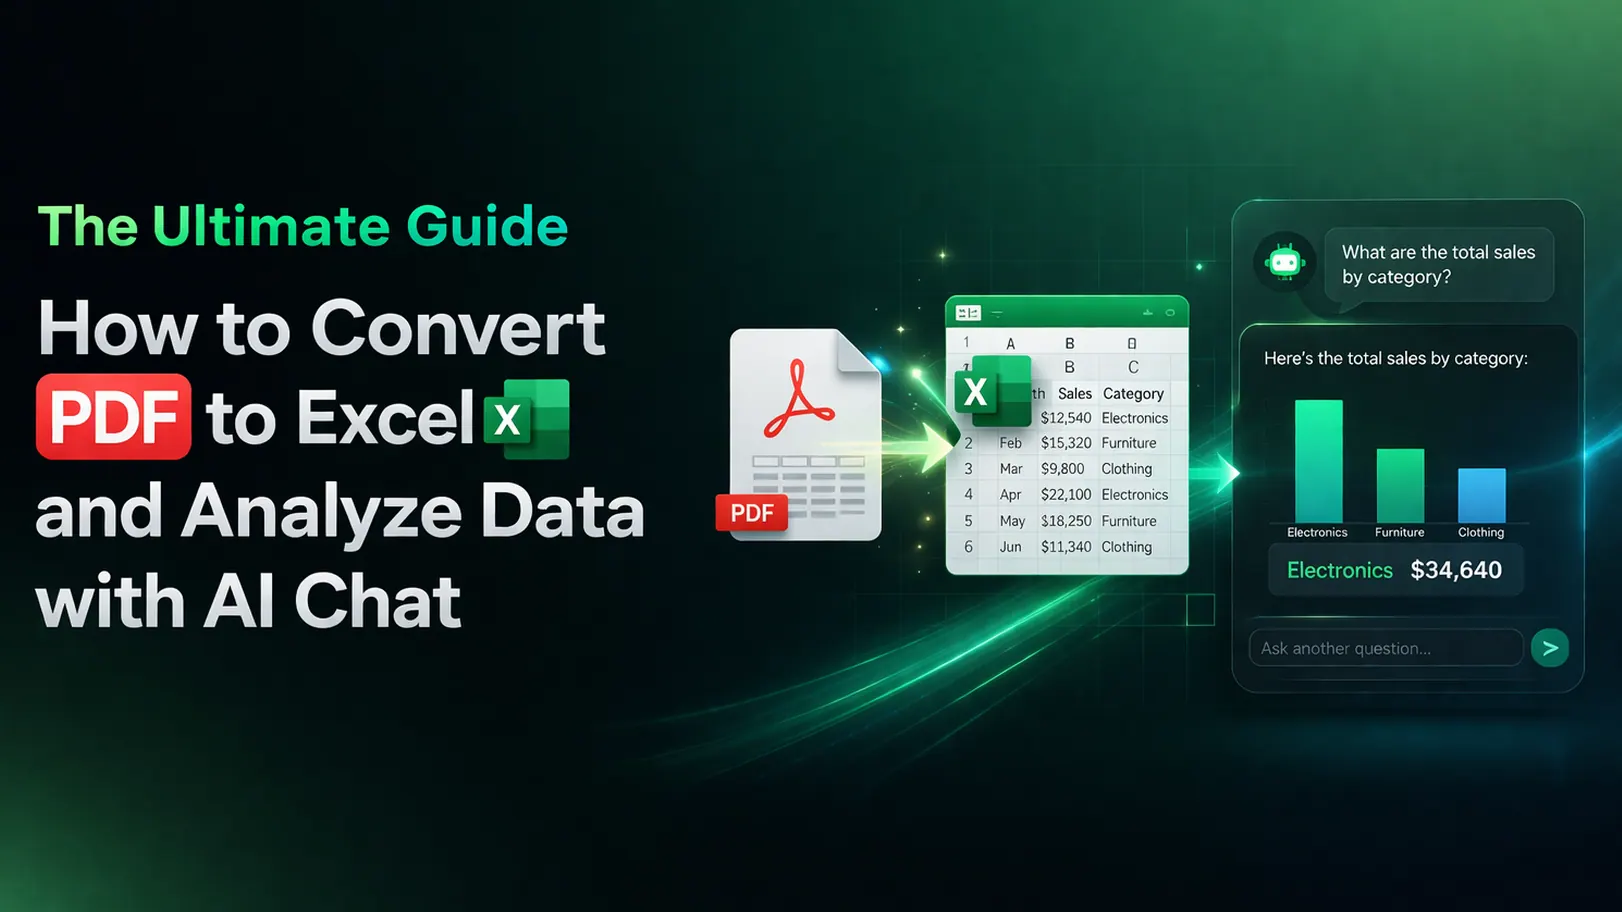
You have a Q2 sales export and one practical question: which channel is pulling down margin, what should the team do next, and how do you turn the answer into something leadership can review?
Search for AI spreadsheet comparison 2026 and you will find products that look comparable but solve very different jobs. One turns a CSV into an iOS dashboard. Another is a computer-use agent that can operate existing desktop software. Another is an AI-native spreadsheet. One is not an AI tool at all; it is a component for previewing XLSX files in a browser.
This guide compares RowSpeak, Vizro, Coasty, Sourcetable, Numerous.ai, Julius AI, Datarelax, and SpreadsheetPreview. The point is not to crown a universal winner. It is to match the files you have, the output you need, and the review process your team must follow to the right product category.
Key takeaways:
- Choose RowSpeak when you need to turn real Excel, CSV, PDF, screenshot, or exported business files into answers, reports, and dashboards that a team can review.
- Choose Vizro for a fast mobile dashboard from a spreadsheet; choose Coasty when the job is operating existing desktop or browser software.
- Sourcetable is an AI-native spreadsheet, Numerous.ai is an AI layer inside Sheets and Excel, and Julius AI is designed for self-serve analysis of uploaded data.
- Datarelax is closer to a data operations platform, while SpreadsheetPreview is a browser-based XLSX preview component. Neither should be treated as a full spreadsheet analysis tool.
Research method, disclosure, and limitations
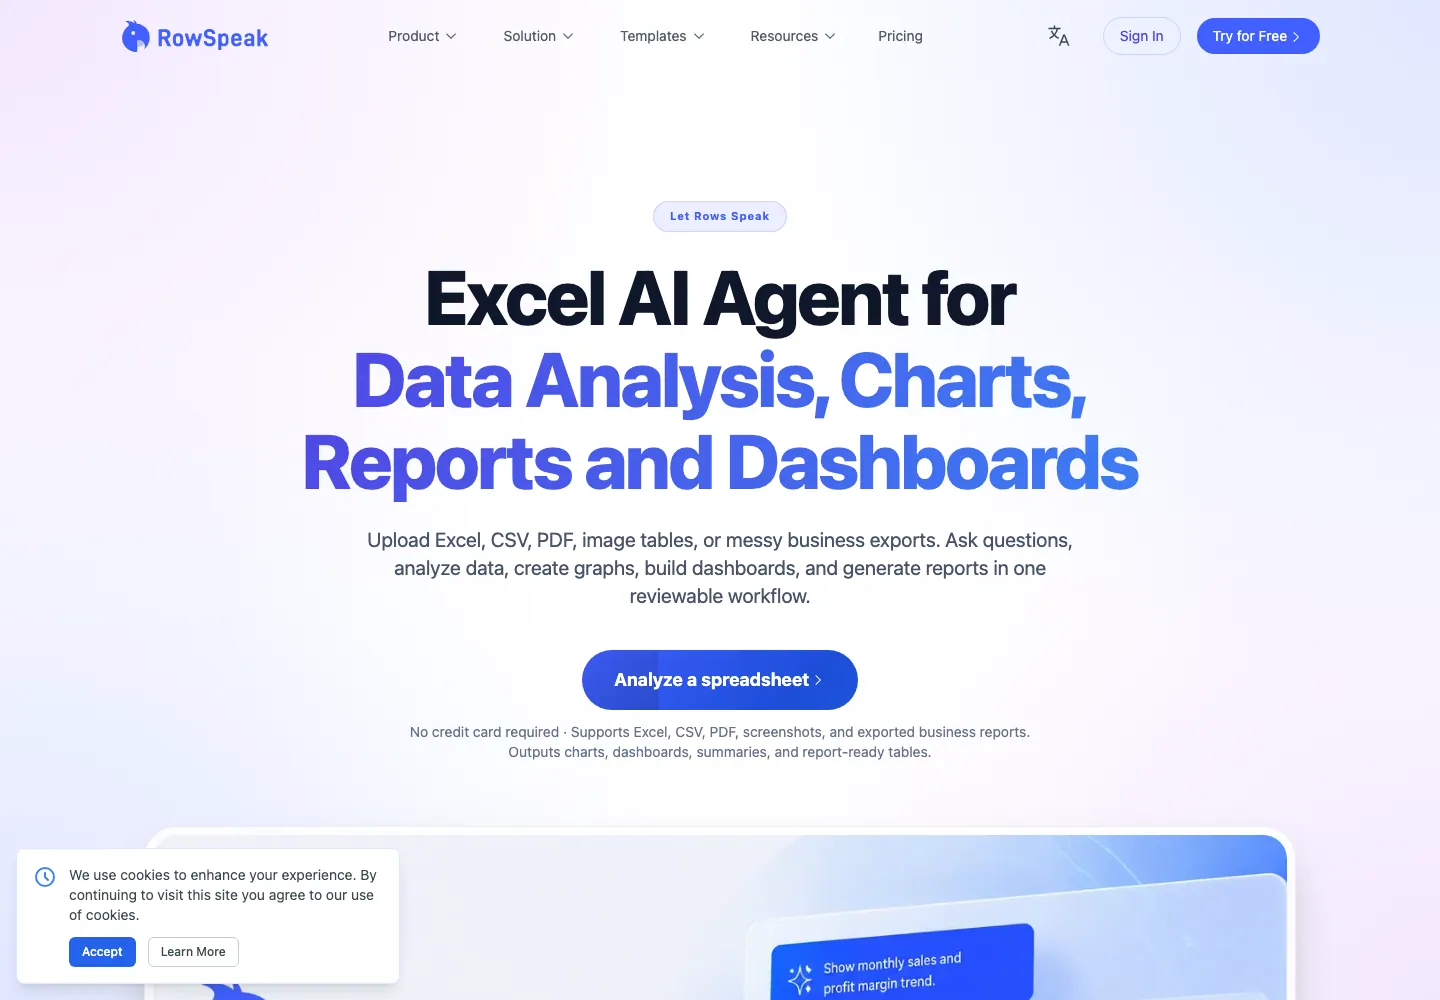
This is a product-scope review, not an in-app performance benchmark. We reviewed publicly accessible product homepages and, where available, feature, documentation, API, pricing, use-case, and sitemap pages on July 20, 2026. We also rendered one logged-out public landing page for the visuals in this guide.
We did not open paid accounts, upload a shared test workbook, or run a timed test across the compared products. That means this article does not rank accuracy, processing time, pricing, data handling, support quality, or feature completeness. A public product visual documents positioning; it is not evidence that a tool passed a spreadsheet test.
The guide is published by RowSpeak. The RowSpeak section therefore describes the product from a product-side perspective. The other sections distinguish documented product positioning from the specific buyer test needed before a purchasing decision. Product source paths are named in prose rather than linked so this article keeps its RowSpeak-only link policy.
These eight tools do not do the same job
Before comparing features, answer four questions: Where does the data start? Who needs the result? What must the result become? Who checks it before it is shared?
Those answers are more useful than asking whether a product “has AI.”
| Tool | Publicly documented scope | Questions to test in a trial |
|---|---|---|
| RowSpeak | File-based analysis, Q&A, reporting, and dashboard workflow | Account-tier limits, performance, and data-policy fit for your deployment |
| Vizro | CSV/Excel upload to an AI-created iOS dashboard, as described on its public homepage | Accuracy on a messy workbook, report-writing depth, and recurring refresh behavior |
| Coasty | Desktop, browser, and terminal computer-use automation, stated on its /computer-use page |
Spreadsheet reasoning, auditability, and reliable completion on your applications |
| Sourcetable | Connectors, an AI spreadsheet assistant, charting, and Quant market analysis on its /features page |
Import fidelity, formula compatibility, and your required sharing workflow |
| Numerous.ai | AI in Excel and Google Sheets; its ecommerce page names product-description generation and review analysis | Recalculation behavior, error handling, and whether it meets report-level needs |
| Julius AI | AI data analysis workspace for exploring uploaded data | File formats, plan limits, export controls, and your required review workflow |
| Datarelax | DBML schema design, column-level lineage, multi-database deployment, orchestration, and dashboards on /features |
Implementation effort, source compatibility, and governance fit |
| SpreadsheetPreview | Browser-based XLSX preview with no upload, server, or Microsoft Office dependency, stated on its homepage | Workbook rendering parity for your files and any analysis requirement |
For a business team, a useful comparison has five tests: Can the tool understand the real file? Can it answer a business question? Can it create an output someone can use? Can the workflow be repeated next month? Can a reviewer check the assumptions and numbers before sharing? Those tests must be run in the product, not assumed from a homepage.
1. RowSpeak: best for files that need to become answers, reports, and dashboards
Best for: finance, operations, sales, growth, and ecommerce teams that need to turn real business files into reviewable conclusions, not just generate a formula or receive a one-off chat response.
RowSpeak combines analysis, Q&A, reports, and dashboards in one web workflow. Its starting point can be an Excel workbook, CSV export, PDF table, screenshot, image-based table, or exported data from systems such as CRM, ERP, accounting, inventory, and advertising tools.
That difference matters in a monthly reporting workflow. You often need more than a refund-rate calculation. You need to check dates, subtotal rows, duplicates, and blanks; explain a change by channel; create a chart; write a management summary; and preserve enough context to refine the result. Manual Excel can do each task. Heavy BI can support some of them after setup. A file-to-report workflow is often a better fit when the files are messy, the reporting cycle is short, and the output must be checked.
Start with a prompt like this:
Analyze this monthly sales export.
Check duplicates, the date range, and blank values first. Then compare revenue,
gross margin, refund rate, and order count by region and channel.
Create charts for the two biggest changes, draft five management-summary bullets,
and list the definitions I need to confirm before sharing.
The product demo below shows the spreadsheet-question pattern behind that prompt: a file is displayed, a natural-language instruction is submitted, and the analysis is returned alongside the data. It illustrates the RowSpeak workflow; it is not a claimed result from the cross-product benchmark protocol later in this guide.
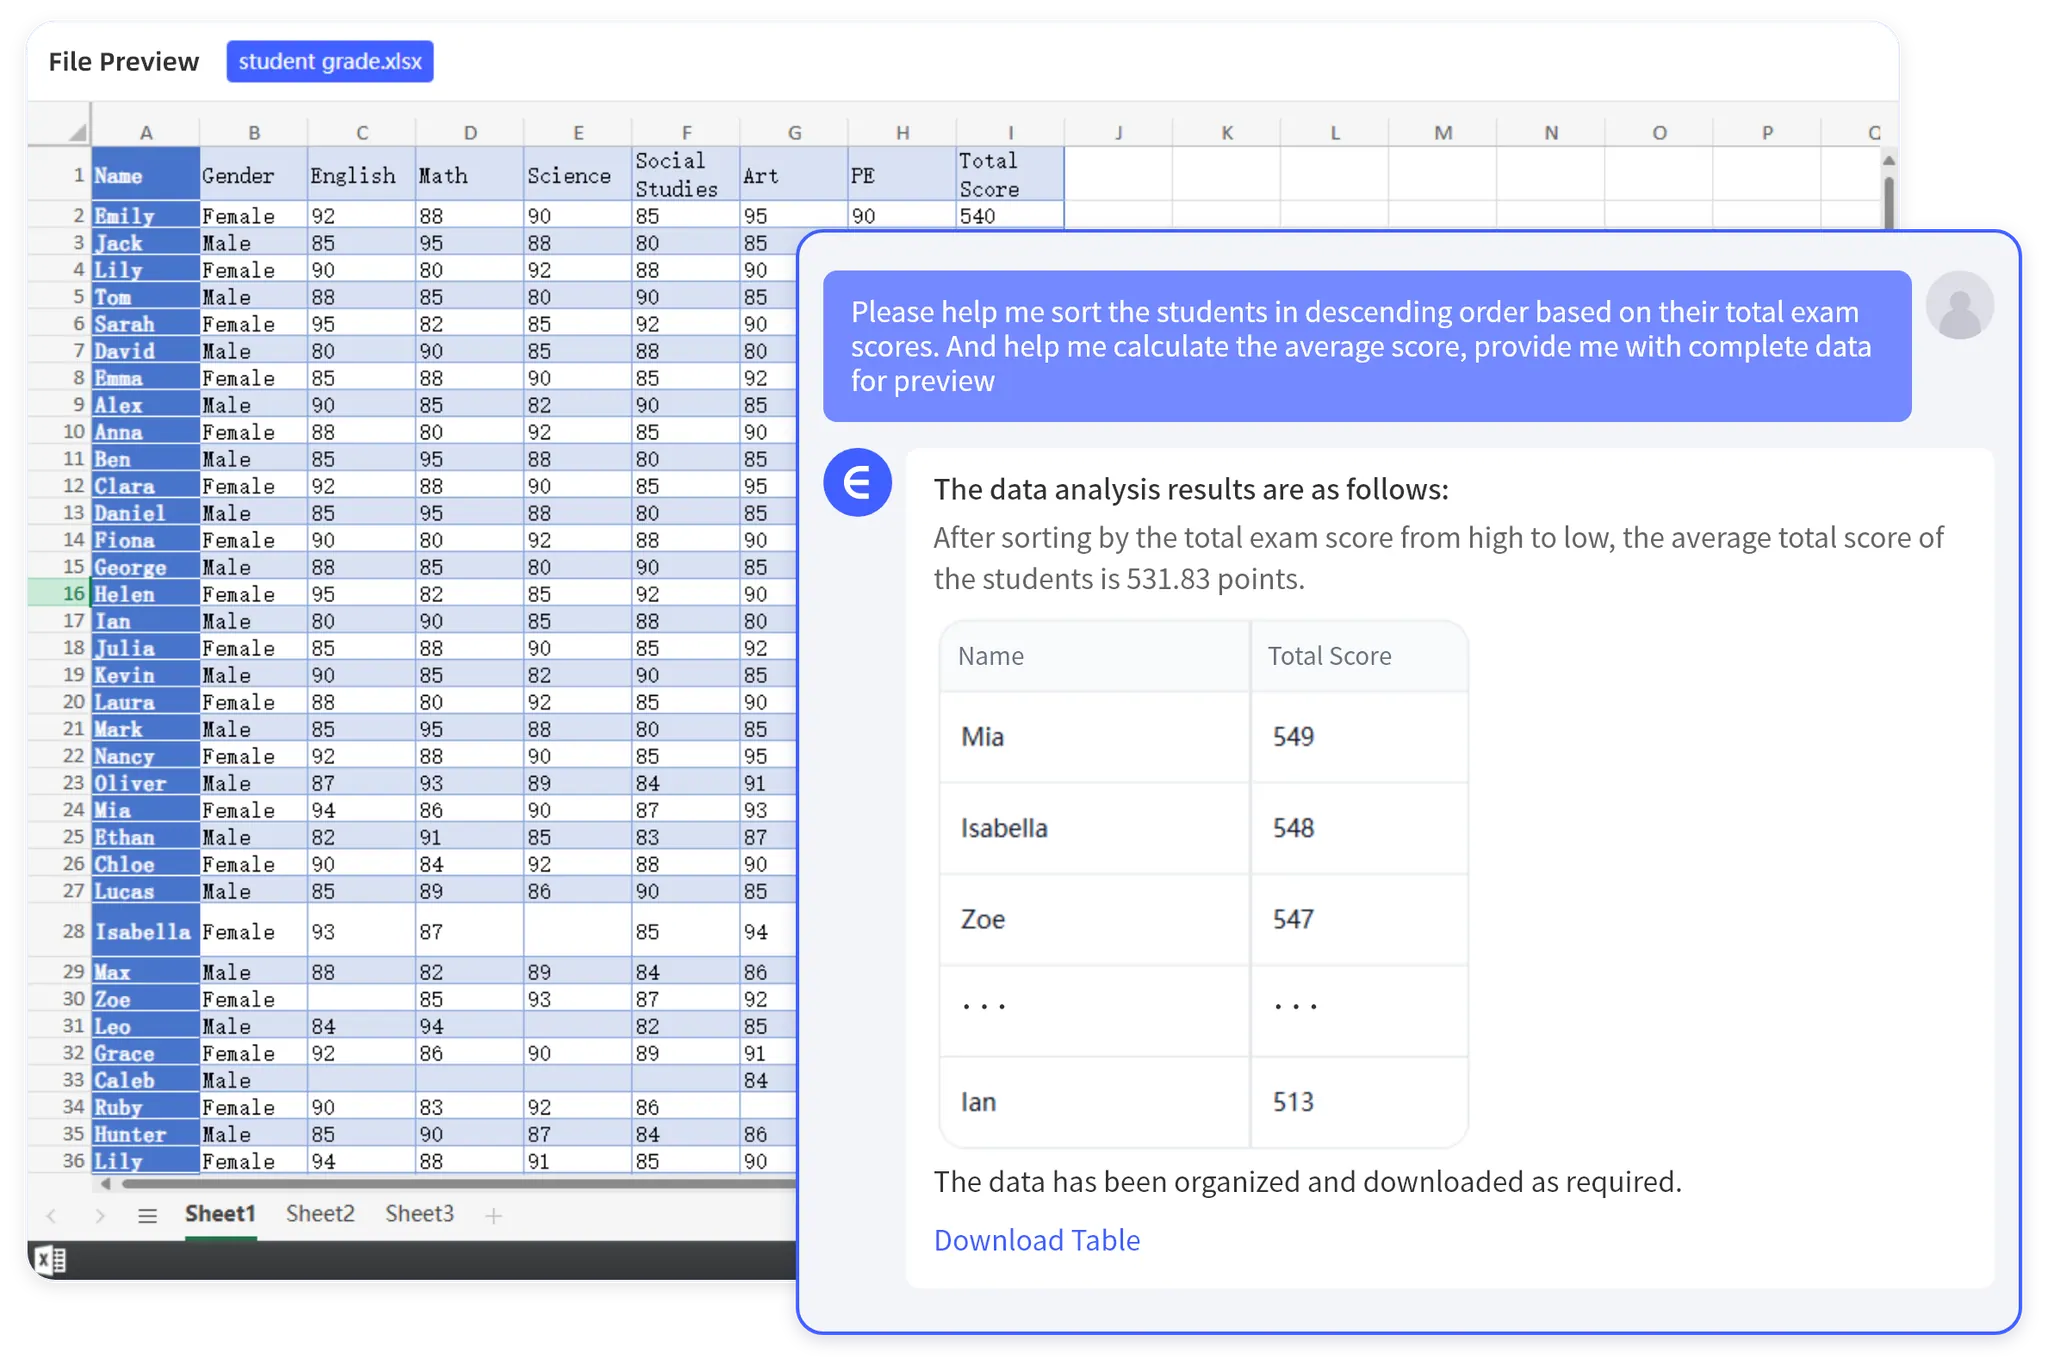
After the first result, review the metric denominator, whether refund and order dates were mixed, whether subtotal rows were included as detail, and whether the chart actually supports the written conclusion. You can explore the spreadsheet analysis workflow, AI reporting workflow, and Excel-to-dashboard workflow to see where RowSpeak fits.
What to test in a trial: Run the prompt above on an anonymized copy of a real export. Check two known values, the inclusion or exclusion of subtotal rows, and whether each management-summary bullet can be traced back to the file.
Main tradeoff: If your team must perform complex workbook-native modeling inside Excel, or it already has a governed, refreshed BI environment, evaluate those tools alongside RowSpeak. RowSpeak is designed to move messy business files to reviewable outputs; it does not claim to replace every Excel or BI workflow.
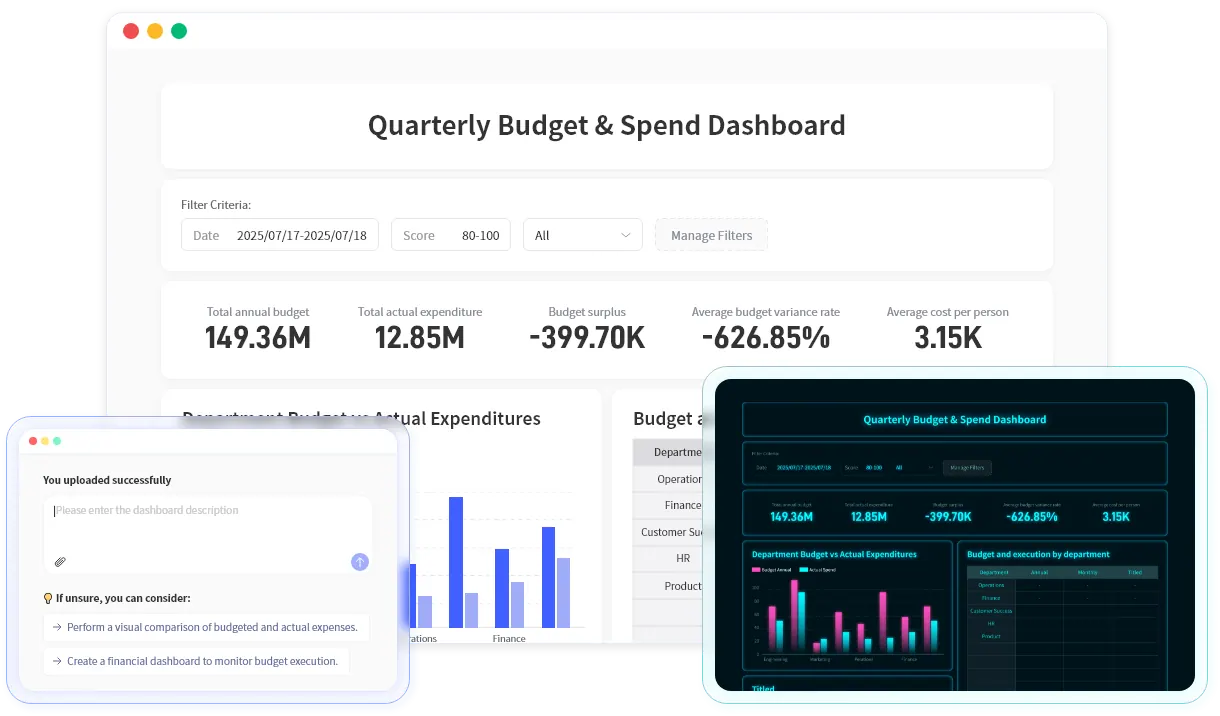
When the reviewed output needs to become a KPI view for discussion, the product visual below shows the table-to-dashboard step. It is a workflow example, not evidence that every source file will produce the same layout without review.
2. Vizro: best for turning a spreadsheet into an iOS dashboard
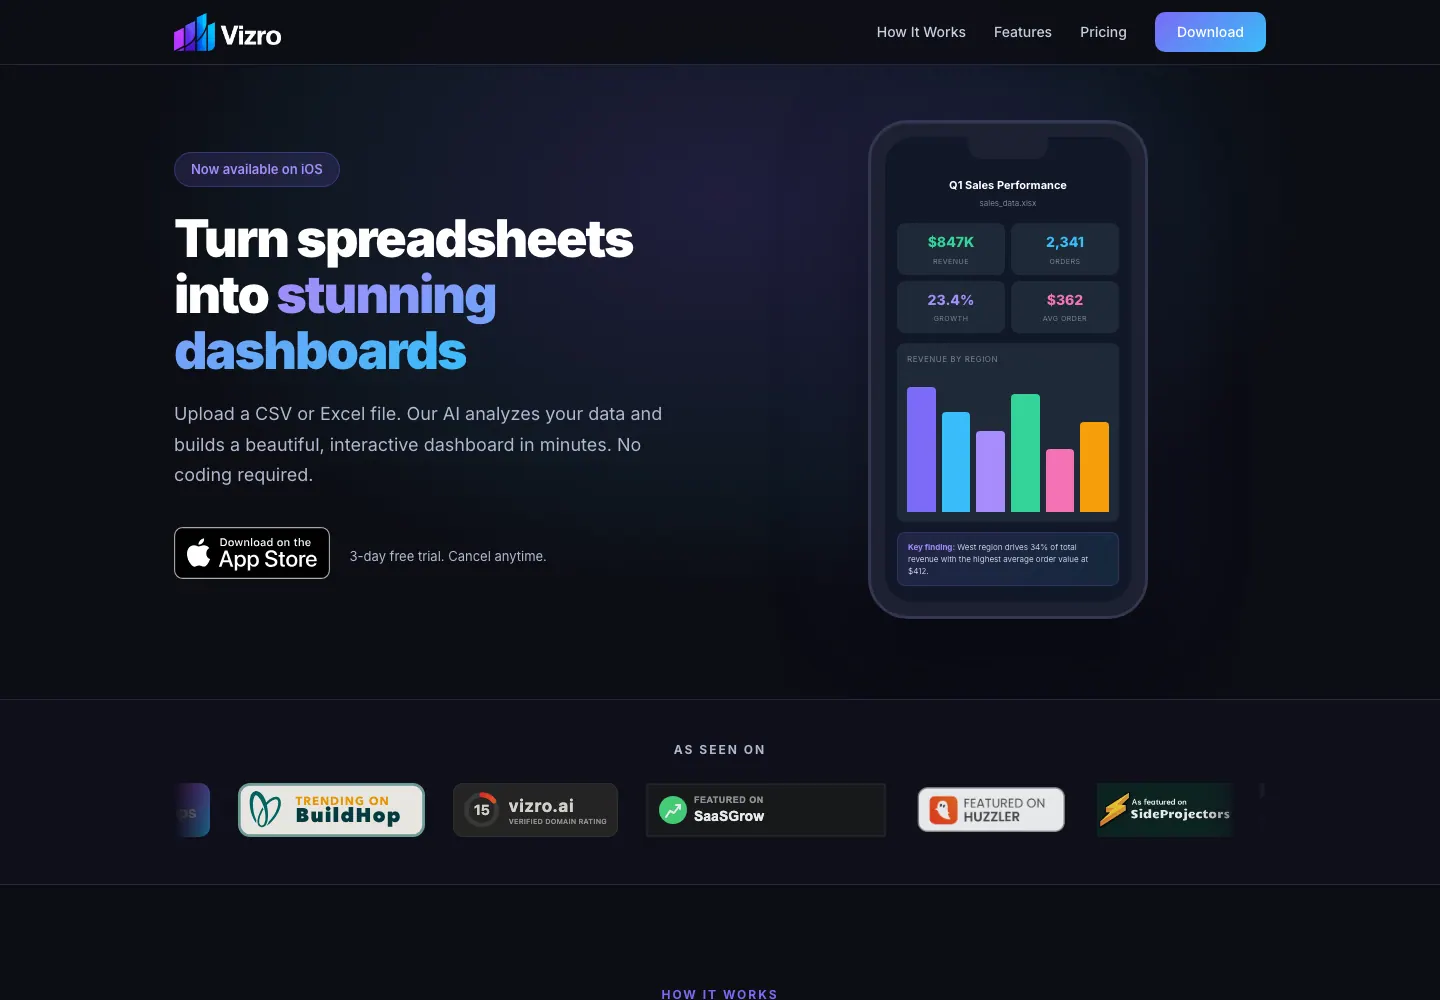
Best for: individuals and small teams that want a quick mobile view of sales, orders, or operating KPIs.
Public evidence reviewed: Vizro's homepage states that users can upload a CSV or Excel file, have AI create an interactive dashboard, and use the product on iOS. This is a specific mobile-dashboard proposition, not evidence of a complete reporting system.
What to test in a trial: Import a weekly export that includes at least one duplicate order, a subtotal row, and a missing value. Check whether the dashboard uses the intended detail rows, whether a metric can be explained, and whether the output is sufficient for the actual decision-maker.
Main tradeoff: A dashboard is not a complete business report. If you also need to investigate root causes, combine PDF or screenshot tables, write an executive summary, and repeat the workflow, test whether the tool covers the work after the first dashboard is created.
3. Coasty: best for agents that operate desktop software and browsers
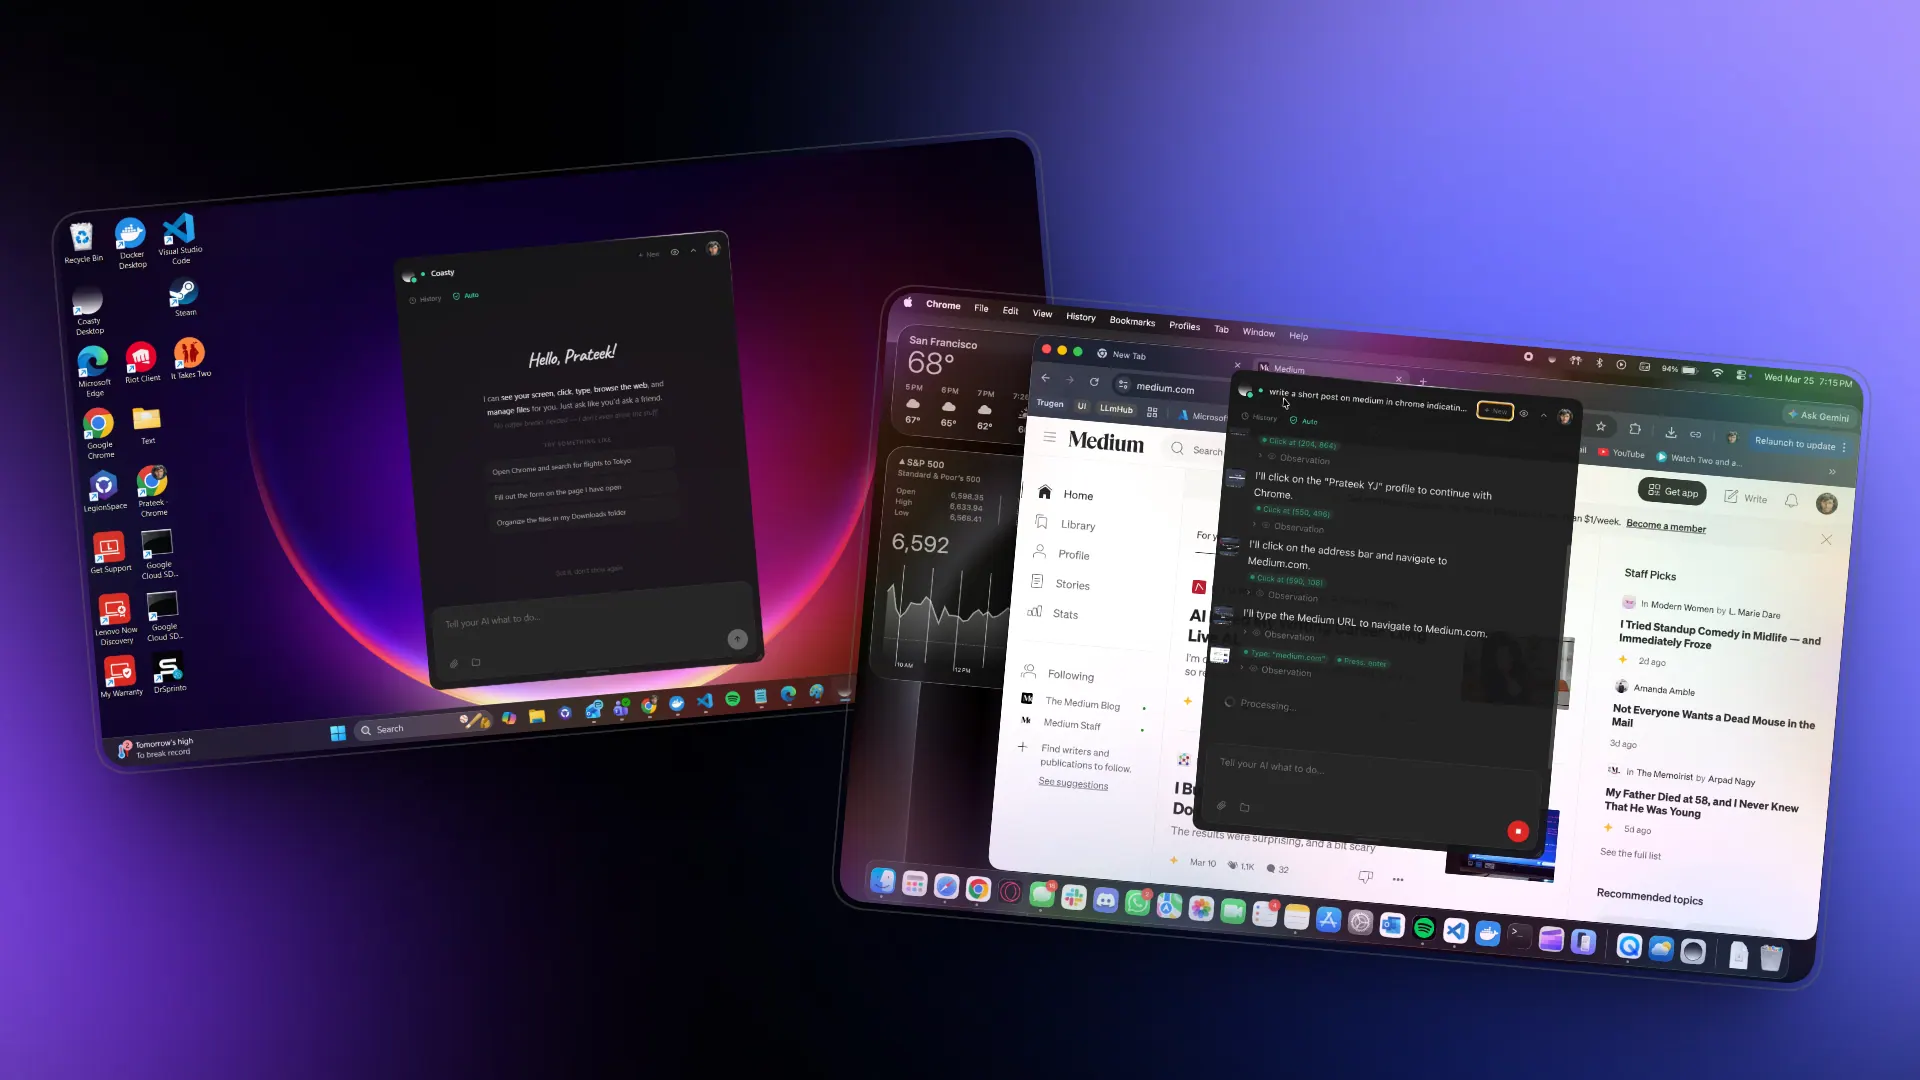
Best for: teams with existing desktop applications, browser steps, or cross-application processes that need an agent to use a screen, mouse, and keyboard.
Public evidence reviewed: Coasty's /computer-use page describes desktop, browser, and terminal automation. The page also presents an OSWorld benchmark result, but that is a vendor-reported computer-use metric; this guide does not use it as a score for spreadsheet reliability or business-analysis quality.
Coasty can therefore participate in a spreadsheet workflow without being the analytical layer of that workflow. If the bottleneck is signing in to a system, downloading a file, opening a spreadsheet, then entering a result in another system, a computer-use agent may address the operational work more directly than a new AI spreadsheet.
What to test in a trial: Use a sandbox account and a non-sensitive workbook. Measure whether the agent completes a defined, reversible path, such as download → open → filter → export, and retain a human check for every transformed number.
Main tradeoff: Do not equate “the agent opened Excel” with “the analysis is correct.” Test operational completion separately from data interpretation, and keep a human review step for any number that affects a business decision.
4. Sourcetable: best for teams that want an AI-native spreadsheet
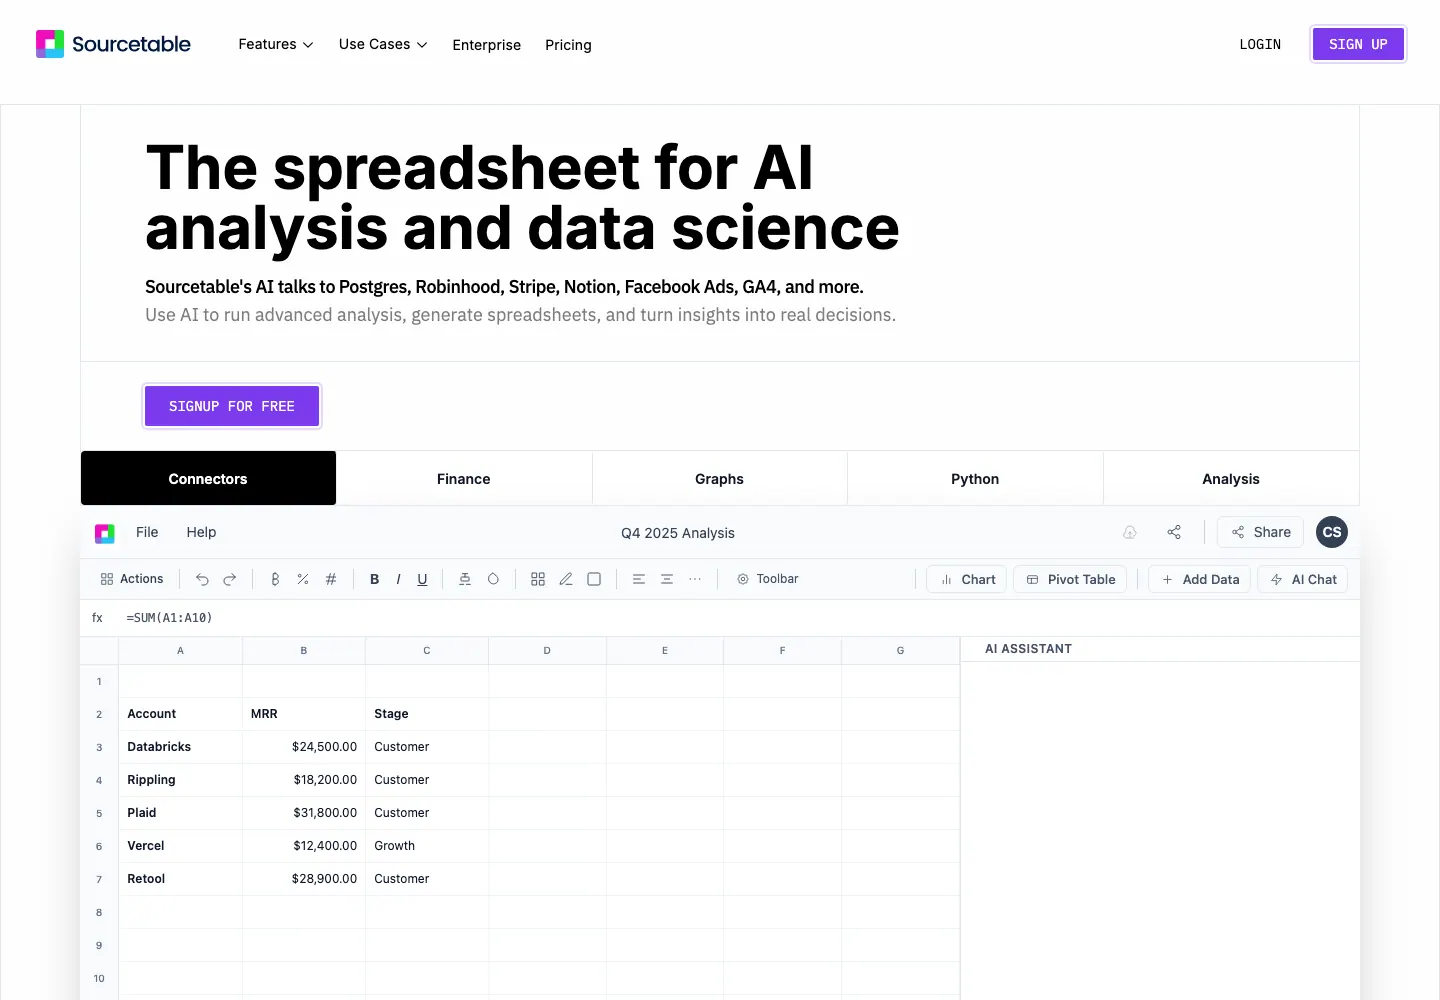
Best for: analysts, operators, and finance users who want to work in a separate spreadsheet product with AI analysis, tables, charts, and models in the same environment.
Public evidence reviewed: Sourcetable's /features page lists connectors, Quant market analysis, an AI spreadsheet assistant, and charting. Its public sitemap also exposes feature areas for analysis, connectors, formulas, and documentation. That supports treating it as an AI-native spreadsheet candidate rather than just a dashboard generator.
What to test in a trial: Import a workbook with multiple tabs and a few known formula outputs. Check import fidelity, formula compatibility, connector fit, sharing, and whether a second user can review or amend the result without rebuilding it.
Main tradeoff: Migration is a real cost. Test an actual workbook with multiple tabs, anomalies, and business rules. Check import behavior, formula compatibility, sharing, and follow-up editing before deciding from a clean demo.
5. Numerous.ai: best for AI tasks inside existing Sheets and Excel files
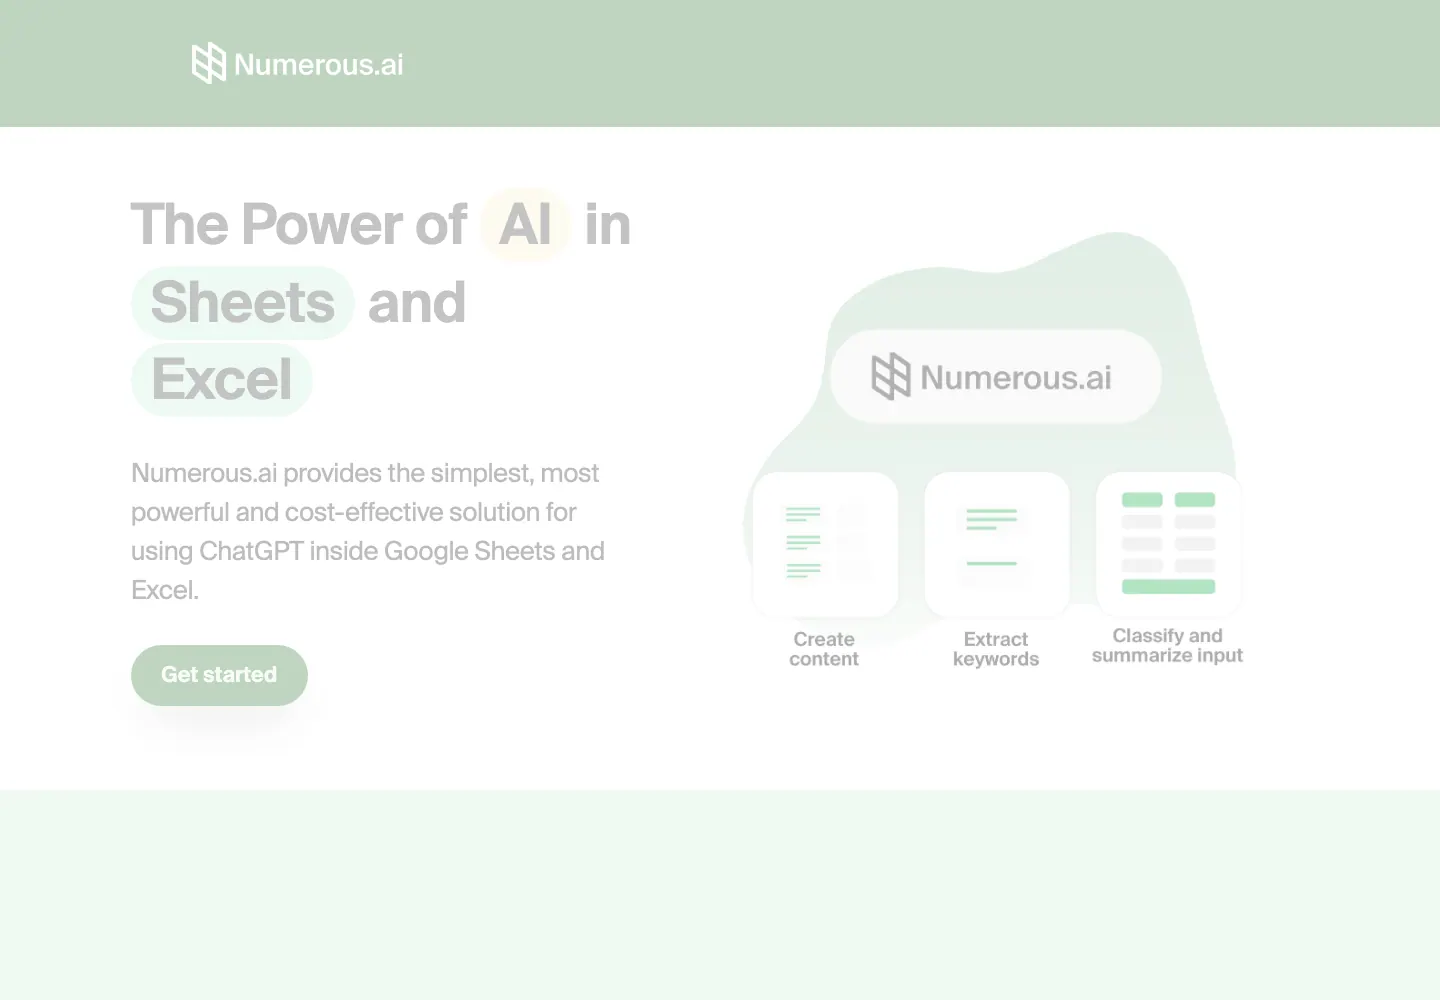
Best for: users who want to stay in Google Sheets or Excel while completing repeatable, cell-level AI work such as content generation, extraction, classification, and cleanup.
Public evidence reviewed: Numerous.ai's homepage positions it as AI in Google Sheets and Excel. Its ecommerce automation page specifically names product-description generation and customer-review analysis. That supports a narrow, sheet-level automation use case rather than a claim that it is a multi-file reporting platform.
What to test in a trial: Run 20 representative rows with a manually labeled answer key. Edit five source cells, recalculate, and check how the output changes. Then test whether the resulting sheet can answer the next reporting question without manual rework.
Main tradeoff: Cell-level AI does not automatically become a reporting workflow. If the final output must explain margin decline, show evidence in a chart, and provide a board-ready summary, you still need to decide how data checks, cross-file context, visualization, and review will happen.
6. Julius AI: best for self-serve exploration of uploaded data
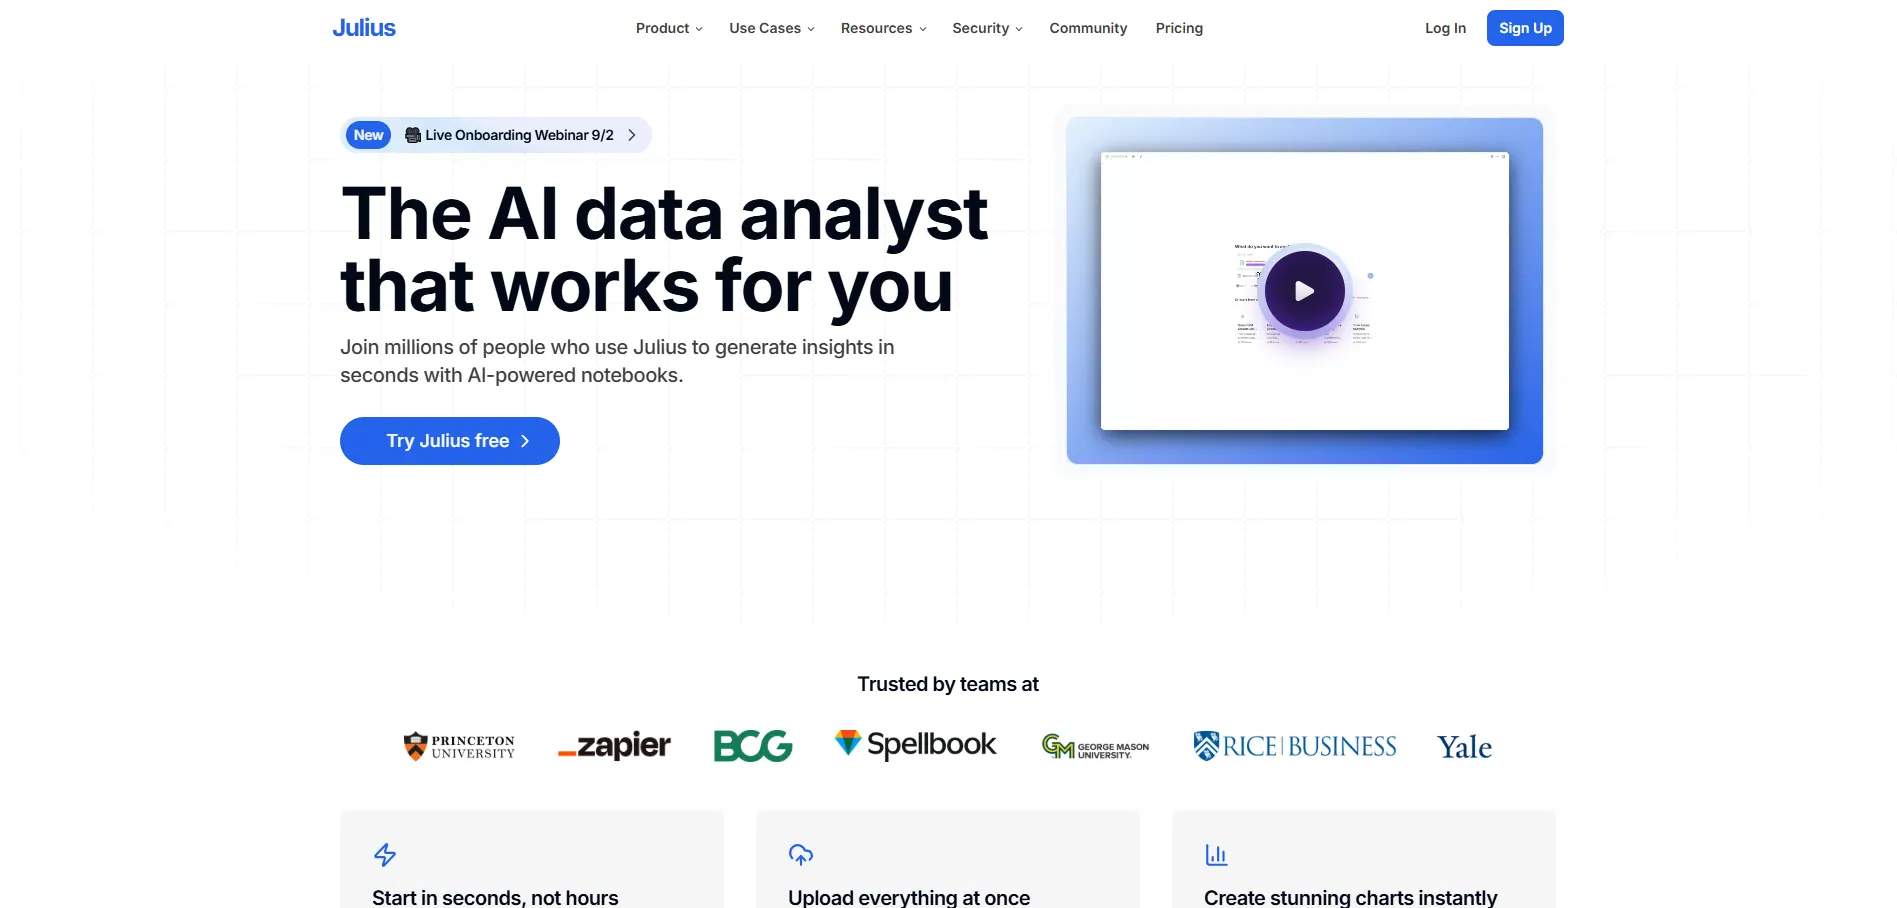
Best for: individual analysts, researchers, and small teams that want to upload data, ask analysis questions, explore trends, and generate charts.
Julius AI is positioned as an AI data analyst for self-serve exploration. The workflow is familiar: upload data, ask a question, inspect a visualization or explanation, and continue the analysis. This is useful when the immediate question is “what changed?” or “which segment behaves differently?”
Buyer trial: Use the same multiple-sheet file and known-answer questions used for the other candidates. Record the imported row count, every calculation, the generated chart, any assumptions, and whether the result can be reviewed by another person.
Main tradeoff: Self-serve exploration and repeatable business reporting are different jobs. If you must turn several source files into consistent, reviewable deliverables every week, test the whole process and its review points rather than only the first answer.
7. Datarelax: best for data operations, modeling, and lineage work
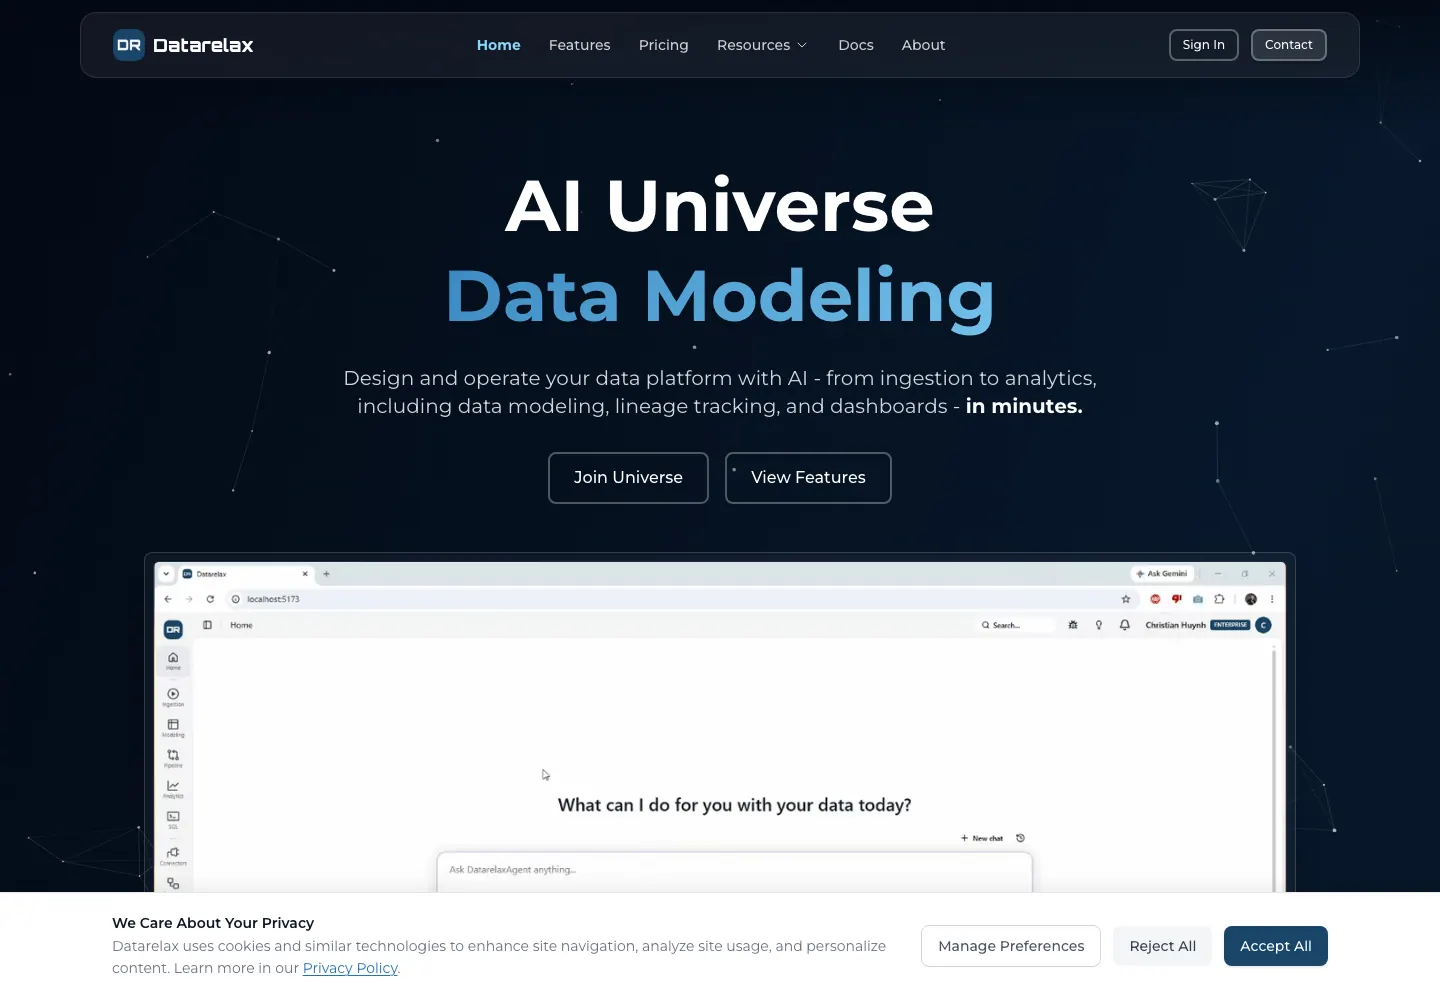
Best for: data teams that need to connect ingestion, data modeling, lineage, database deployment, and analytics in a fuller data operations platform.
Public evidence reviewed: Datarelax's /features page names AI-powered DBML schema design, column-level data lineage, multi-database deployment, pipeline orchestration, and interactive analytics dashboards. This is direct evidence of a data operations and modeling scope, not a claim that it is a spreadsheet chatbot.
What to test in a trial: Ask the data team to map one real source to the desired model, lineage record, and dashboard. Measure the implementation steps and ownership required before comparing it with an upload-and-report workflow.
Main tradeoff: This category usually requires clearer ownership, a data model, and an implementation plan. Confirm data sources, deployment, access, and maintenance responsibilities before treating it as a ready-to-use spreadsheet assistant.
8. SpreadsheetPreview: best for browser-based XLSX viewing, not AI analysis
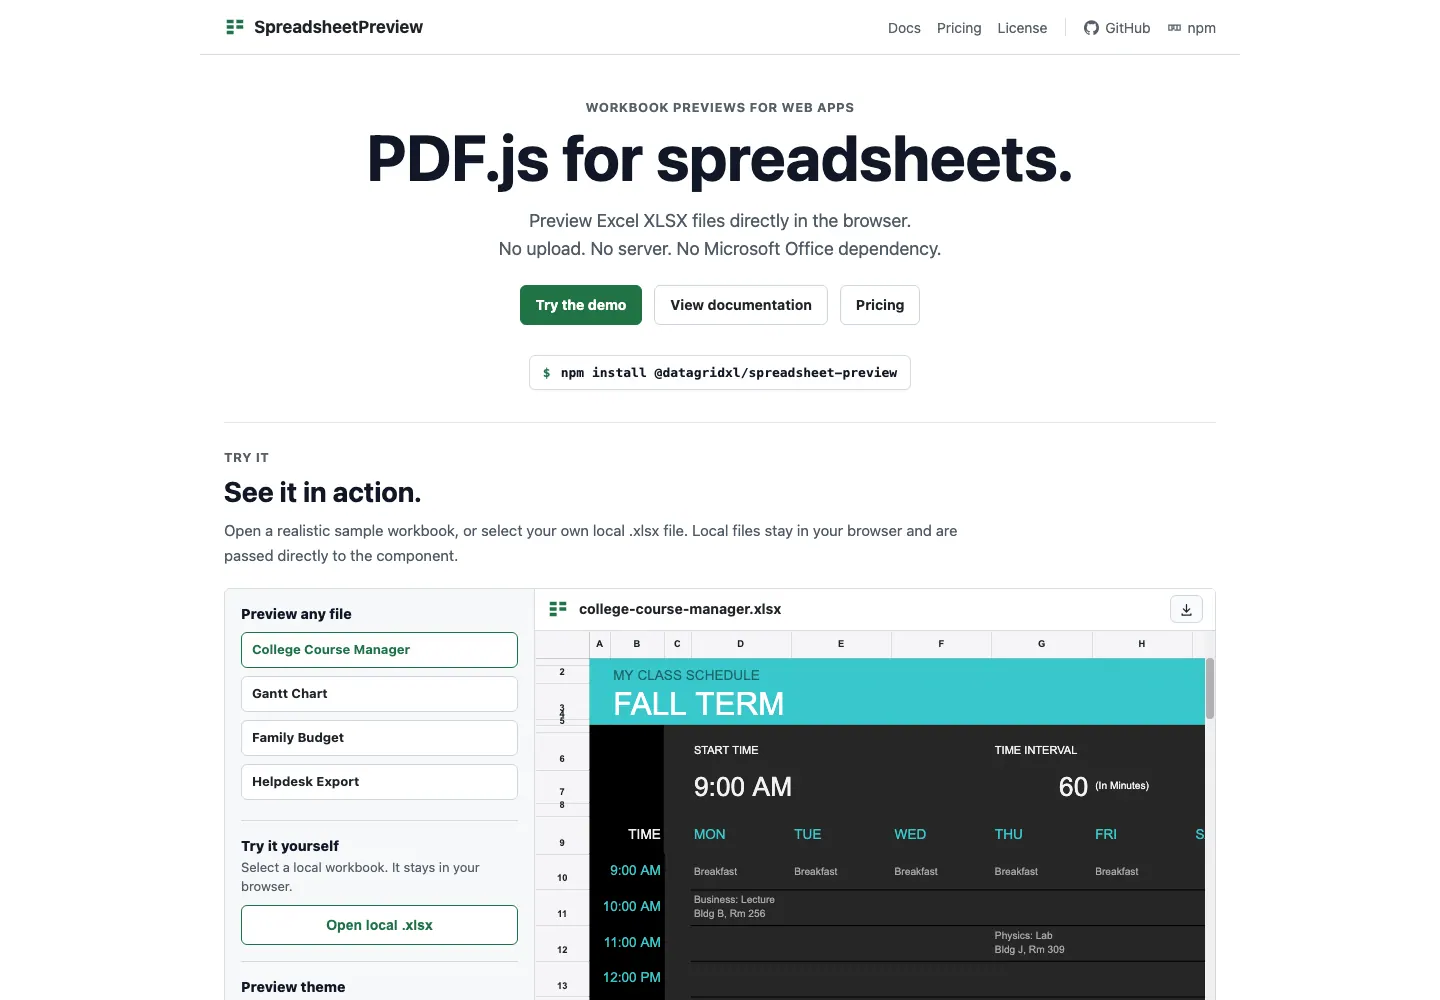
Best for: developers who need to show Excel workbooks inside a web application without uploading them, using a server, or depending on Microsoft Office.
Public evidence reviewed: SpreadsheetPreview describes itself as “PDF.js for spreadsheets” and states that it previews XLSX directly in the browser with no upload, no server, and no Microsoft Office dependency. This represents a file-presentation capability, not an AI analysis claim.
What to test in a trial: Test the exact workbooks your users open, including formulas, merged cells, conditional formatting, wide sheets, and large files. Compare the rendered view with the native workbook before using it in a client-facing flow.
Main tradeoff: It does not answer data questions, generate a report, or act as an AI agent. Separating preview requirements from analysis requirements usually produces a more reliable product decision.
The 2026 signal: the market has split by workflow layer
These products appearing in the same search result does not make them substitutes. It shows that the market has split into distinct layers:
- Mobile visualization: Vizro turns an imported file into a dashboard.
- Operational execution: Coasty uses existing desktop and browser software through an agent.
- AI-native spreadsheet: Sourcetable combines spreadsheet work, data connections, and AI in its own environment.
- In-sheet assistance: Numerous.ai adds AI inside existing Excel or Google Sheets work.
- Self-serve analysis: Julius AI supports questions and charts from uploaded data.
- Data operations: Datarelax focuses on ingestion, modeling, lineage, and deployment.
- File presentation: SpreadsheetPreview solves browser preview, not analysis.
- File-to-business-output: RowSpeak connects real files to analysis, answers, reports, and dashboards in a reviewable web workflow.
Start by excluding categories that do not fit the immediate job. A data platform is not better because it has more capabilities. An add-in is not a reporting system simply because it stays close to Excel.
A reproducible test protocol, not claimed benchmark results
The comparison above does not publish a shared 8-tool performance score. To create one, the same test file, account tier, product settings, prompt, timestamp, and human-review rules would need to be recorded for every tool. Without that, a numeric score would be false precision.
Use an anonymized workbook such as messy-q2-sales-export.xlsx with a documented schema: order ID, order date, region, channel, revenue, COGS, refund amount, and a separate mapping sheet. Include known defects: duplicate order IDs, subtotal rows, blank COGS cells, two date formats, and refunds recorded after the order date. Keep a control sheet that states the correct row count and two expected metrics.
Then run these five steps for every candidate:
- Import and understanding: Does the tool recognize headers, dates, currencies, sheets, and subtotal rows correctly?
- Question and calculation: Ask it to compare revenue, gross margin, refund rate, and order count by region and channel. Compare two known results.
- Visualization and explanation: Ask for a chart that supports the conclusion, a likely explanation, and a clear statement of what cannot be concluded.
- Deliverable: Ask for five management-summary bullets. Check that every bullet can be traced back to the file.
- Repeatability: Replace the file with the next month's export. Can you reuse the instruction, definitions, and delivery format?
Record the result in a test log: product and account tier, file hash, import time, detected rows, prompt, raw output, corrections made, final metrics, screenshot, and reviewer sign-off. For financial, payroll, employee, or customer-level files, remove unnecessary identifiers first and confirm the relevant data boundary before testing. Teams that need a controlled deployment path can review RowSpeak private deployment.
Before running analysis, the file may need basic cleanup. This product demo shows a plain-language request to standardize values and fill specified blanks; use the resulting changes as a review item, not as a substitute for checking the source file.
How to choose
Start with a data platform or governed BI option when you already have a data team, data model, and semantic layer. Start with an add-in when you only need a narrow task inside an existing sheet. Start with a computer-use agent when the problem is moving between applications.
But when the work repeatedly begins with Excel, CSV, PDF, screenshots, or business exports and must end as a reviewable answer, chart, dashboard, and report, test the full file workflow first. That is where RowSpeak is designed to fit between manual spreadsheet work and a heavier BI project.
What this guide can and cannot tell you
It can help you avoid category errors: using a browser preview component as though it were an AI analyst, buying a data-platform project for a same-day spreadsheet report, or assuming a computer-use benchmark proves finance-report accuracy.
It cannot tell you which tool is fastest, most accurate, cheapest, safest, or best for your files. Those are testable questions, but they require the shared-file protocol above and a reviewable record of results. Until that work is complete, treat product claims as scope signals and run a controlled trial before making a production decision.
Try RowSpeak with your next real export
Upload your next sales, finance, inventory, or operations export. Ask the business question, then review the charts, summary, and dashboard before sharing. Start with RowSpeak to put your spreadsheet-to-report work in one reviewable workflow.