An AI spreadsheet is not simply a spreadsheet with a chat box. For a business team, it is a workflow that helps turn data files into a checked answer, chart, dashboard, or report.
That distinction matters. A quick question such as “Which region grew fastest?” can be useful. But a weekly KPI report also needs the right source file, stable metric definitions, exceptions to review, and a format other people can understand.
This article explains where AI spreadsheets help, where they do not, and how to use one for a repeatable reporting job. It uses recorded RowSpeak outputs, including visible defects, and a downloadable workbook with known edge cases rather than relying on an abstract feature list.
Key takeaways:
- An AI spreadsheet is useful only when it preserves the path from source rows and formulas to a reviewable answer, chart, workbook, report, or dashboard. A chat response without that path is analysis assistance, not a reporting control.
- Keep Excel or Sheets as the system of record when cell-level formulas and workbook delivery matter; use a file-to-report workflow when several exports need cleaning and explanation; move stable shared metrics into BI when refresh, lineage, and access control become primary.
- A good test contains an ambiguous date, a duplicate correction, a hidden formula dependency, a renamed column, and a known control total. The AI should surface uncertainty instead of filling gaps with a plausible story.
- RowSpeak fits the middle layer: real Excel/CSV/PDF/image inputs to reviewable outputs. It does not remove the need for metric owners, source reconciliation, or a governed BI layer where one is required.
- Recorded runs show both sides of the category: RowSpeak produced downloadable analysis, charts, dashboards, and workbooks, but also left mixed date types, speculated about a
53,250audit residual, and generated chart areas that still needed repair.
What makes a spreadsheet workflow “AI”?
AI becomes useful in a spreadsheet workflow when it can help you do one or more of these jobs:
- explain a formula or propose a starting formula;
- identify inconsistent labels, blank values, or possible duplicates;
- answer questions about an uploaded table in plain language;
- suggest a chart for a defined business question;
- draft a summary of a checked analysis;
- repeat a file-to-report process with the same review steps.
It does not mean the AI understands your business definitions automatically. “Revenue,” “active customer,” and “refund rate” can have different meanings across teams. Your team must still define the measure and confirm the output.
AI spreadsheet, spreadsheet chatbot, or BI tool?
| Approach | Useful when | Watch for |
|---|---|---|
| Manual Excel or Sheets | The team needs workbook control and established formulas | Repetitive cleanup and report production can become slow |
| Generic AI chat | You need a one-off explanation or exploratory question | Prompts, definitions, and outputs may be hard to repeat |
| AI spreadsheet workflow | Files need cleaning, analysis, charts, and a reviewable report | Data checks and ownership still need to be designed |
| BI platform | The business needs governed metrics across many live systems | Setup can be disproportionate for a few recurring exports |
The right choice depends on the reporting job, not on which option has the newest AI label.
What a real output can get right—and still get wrong
The screenshot below comes from a recorded formula-auditing demonstration. The visible values imply net income of 500,000 - 180,000 - 125,000 = 195,000, while the workbook reports 141,750. The output notices the 53,250 residual instead of pretending the visible arithmetic reconciles.
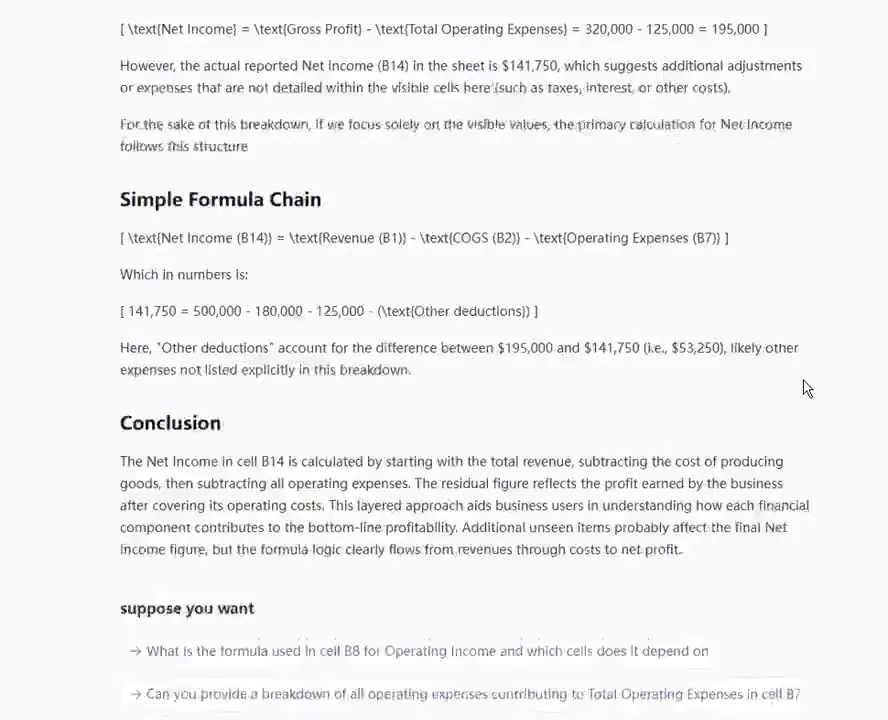
That is useful, but the output then suggests that “other deductions” probably explain the difference. “Probably” is the boundary a reviewer must challenge. Until the source formula, hidden sheet, named range, tax line, interest line, or adjustment journal is inspected, the correct conclusion is unreconciled difference, not other deductions.
The screenshot also contains raw formula markup in the rendered answer. That presentation defect does not change the arithmetic, but it matters for a management-facing deliverable. A trustworthy workflow must review both calculation evidence and output quality.
This example shows why E-E-A-T is not created by adding a screenshot alone. The article must explain what the screenshot proves, where the reasoning becomes speculative, and what the reviewer should do next.
Four recorded outputs, four different acceptance gates
Some repository recordings use the previous Excelmatic name; Excelmatic is now RowSpeak. The product surface is evidence of execution, but each artifact still needs a different validation step.
| AI spreadsheet job | Recorded output | What worked | What failed or remains unresolved |
|---|---|---|---|
| Clean a file | Duplicate removal and a downloadable cleaned artifact | The workflow identifies transformations and returns a file | One visible pass leaves mixed date types; later steps are not proven to preserve prior constraints |
| Analyse a table | Sorted output for 101 records, mean 49.85, SD 29.1 |
Method, summary, and downloadable workbook are visible | Standard-deviation convention and independent recalculation are not captured |
| Audit a workbook | Visible 53,250 residual |
The discrepancy is surfaced | The answer suggests “other deductions” without source evidence |
| Build a workbook/dashboard | Four-sheet .xlsx and a dashboard review surface |
Structured artifacts are created | Several chart areas are incomplete; KPI definitions are not reconciled in the recording |
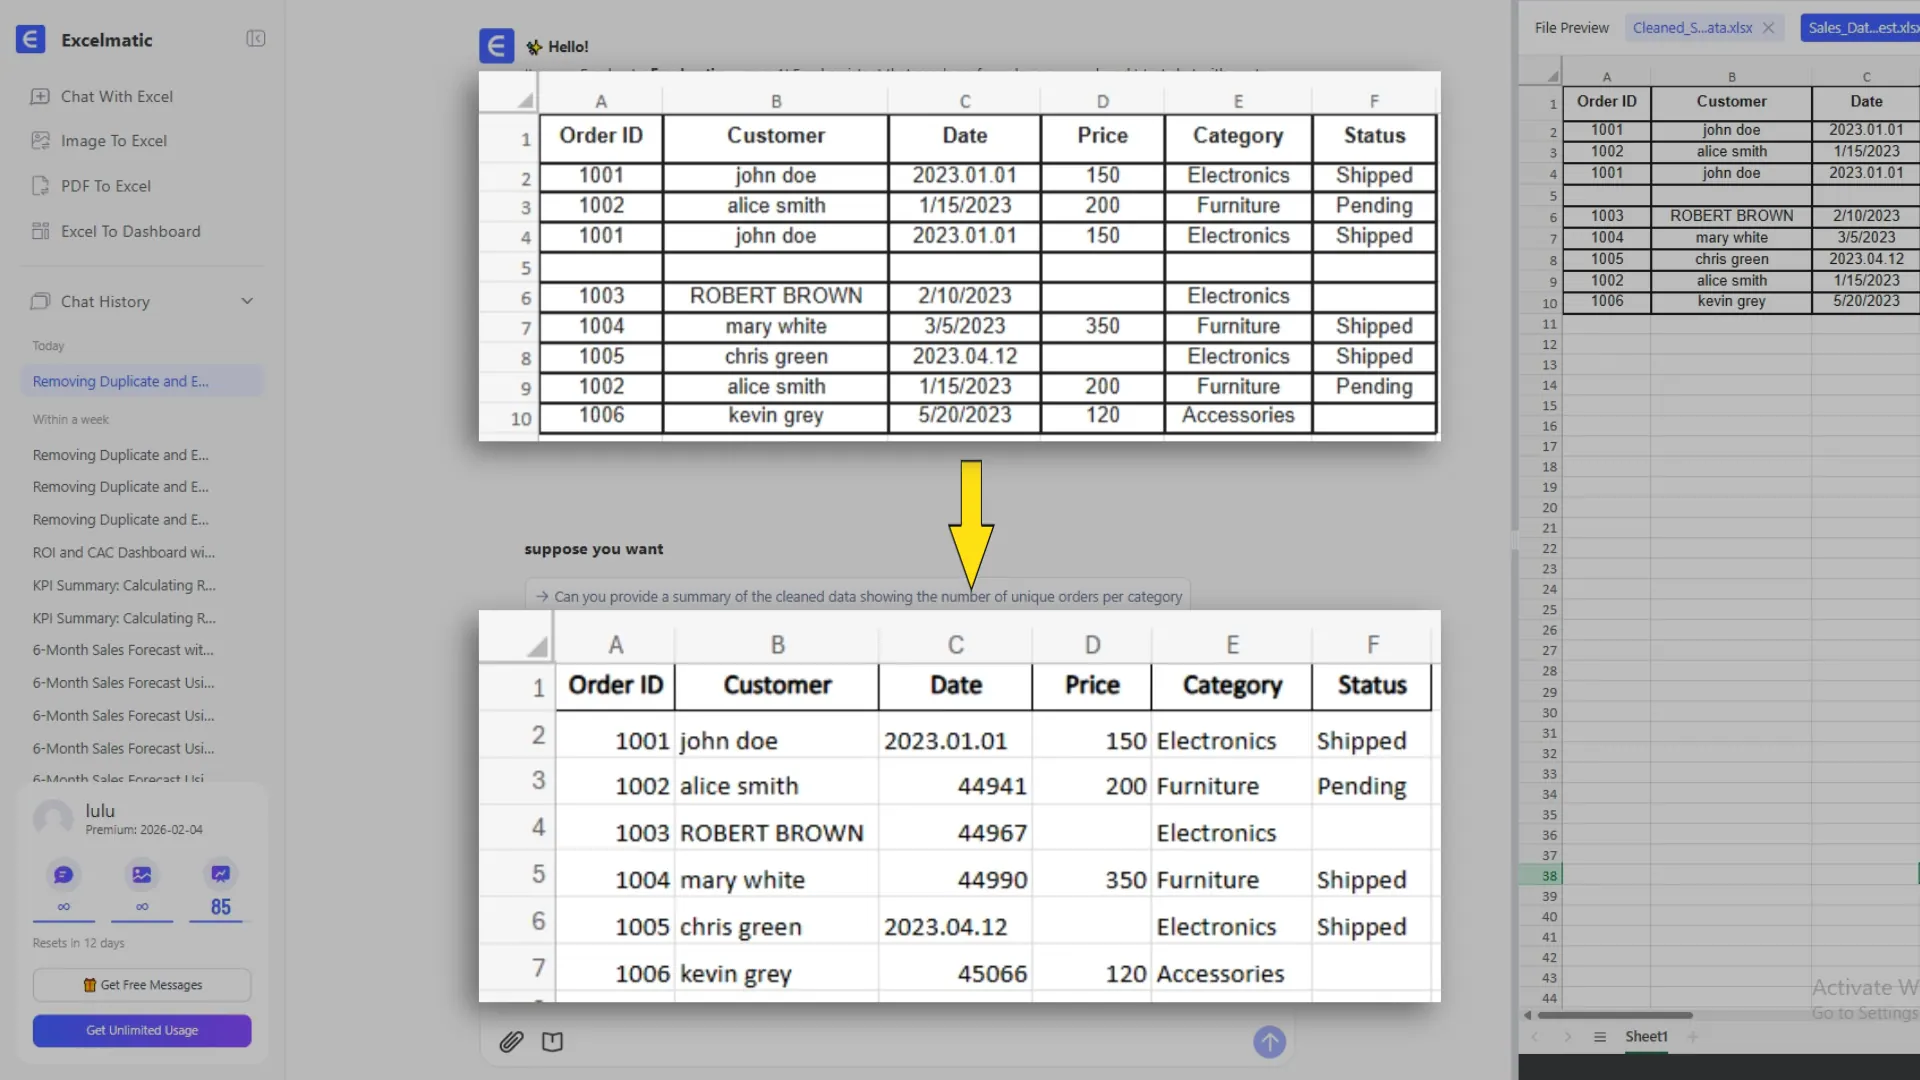
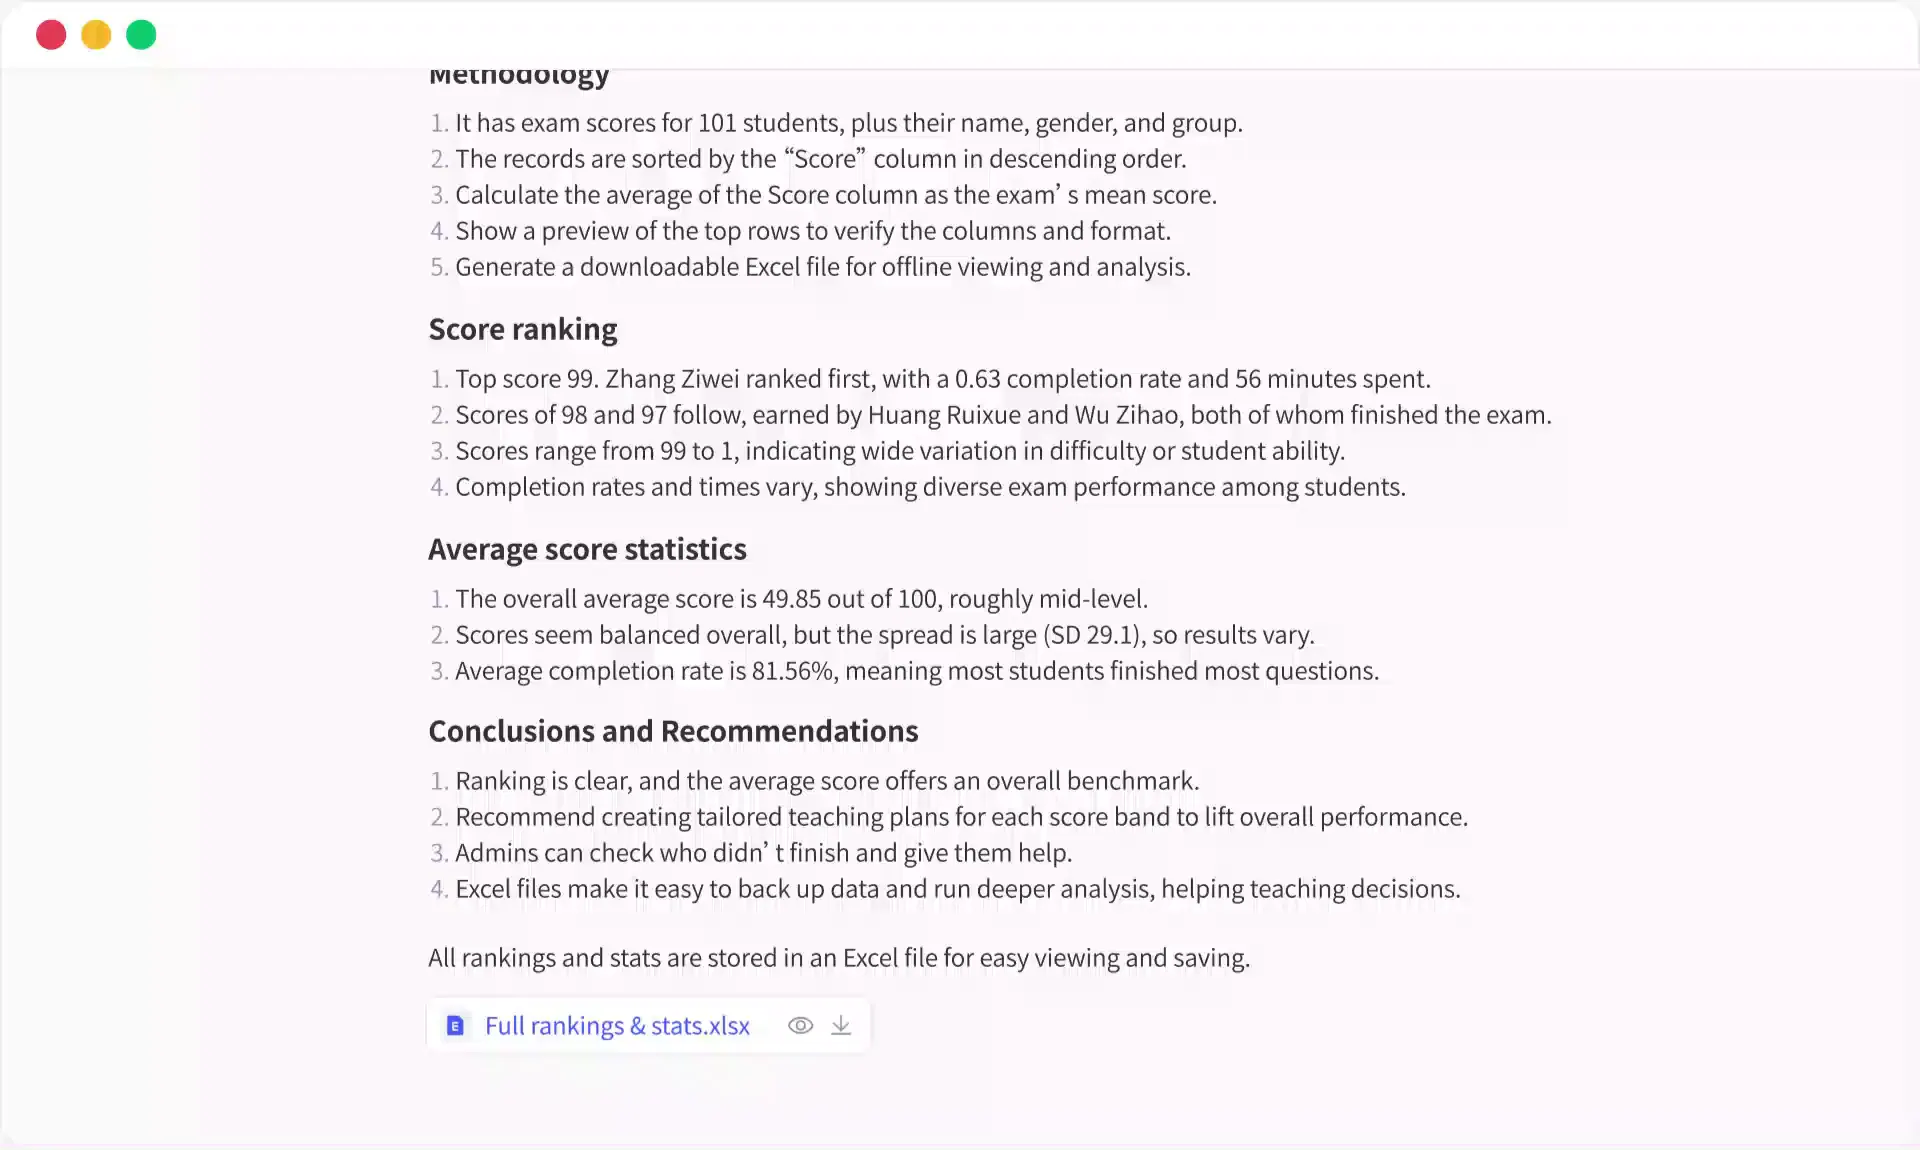
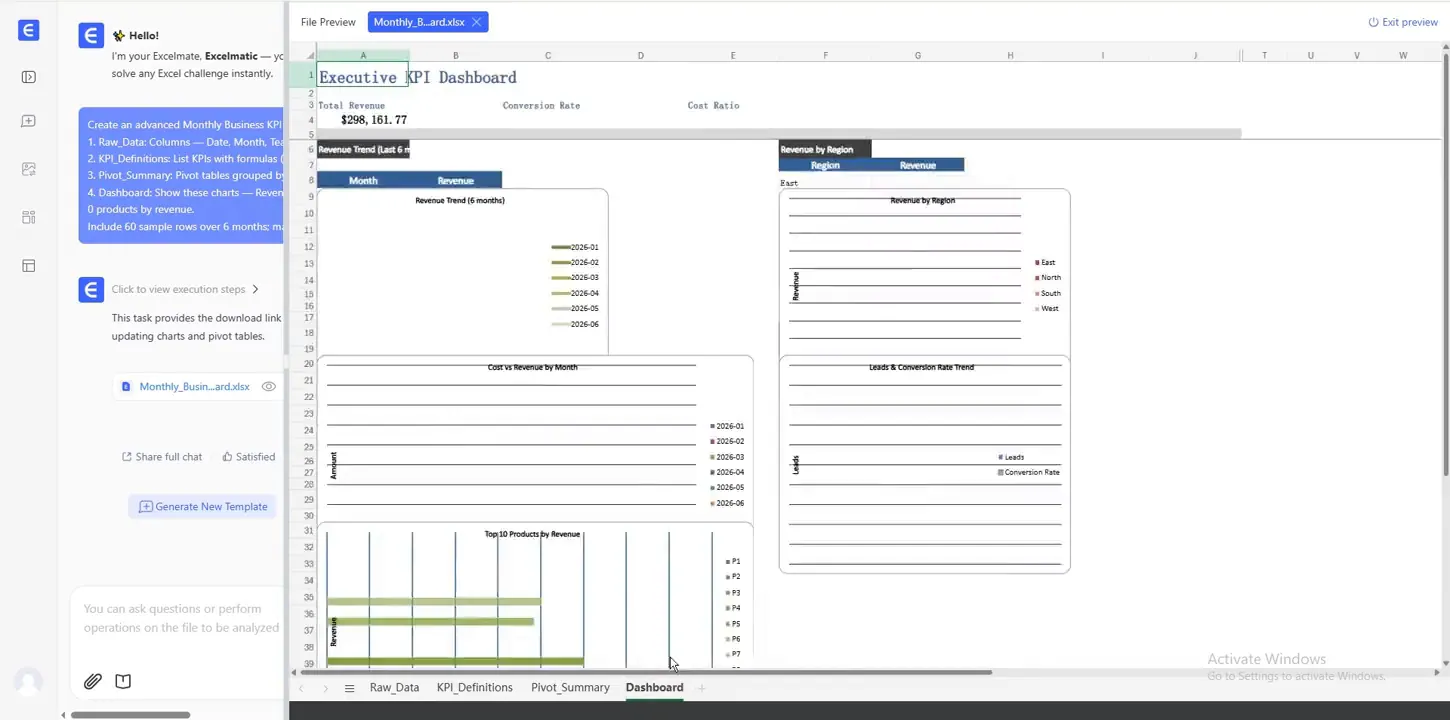
The screenshots do not prove a 50 MB file limit, response-time advantage, perfect accuracy, or repeatability across account tiers. Those claims remain not tested in this article.
Download a small AI spreadsheet test
Download Executive_Quickstart_Sample.xlsx. The workbook contains eight nonblank records and one entirely blank row. It also contains an exact duplicate ORD-001, mixed date representations, one blank status, and a legitimate -150 profit value.
Ask an AI spreadsheet to profile the file before changing it. The expected cleaned state is seven unique nonblank records if—and only if—it removes the exact duplicate while preserving the negative profit and missing status. Fail the test if the blank row becomes a transaction, a missing status is invented, the negative value becomes zero, or date conversion occurs without a declared convention and change log.
The 10-second clip shows a recorded file-cleaning prompt and downloadable-artifact path. It demonstrates interaction, not processing speed.
A weekly KPI review example
Consider a sales operations manager who receives a weekly CRM export and a separate ad-spend CSV. Every Friday, the manager needs to answer:
- Did qualified pipeline grow?
- Which channel changed most week over week?
- Are there missing owners or stale deals to investigate?
- What should the sales leadership team do next week?
In a manual workflow, the manager may clean date fields, build pivots, compare last week, make two charts, and write an email. A chatbot can answer one question, but it may not preserve the full reporting process.
An AI spreadsheet workflow should instead follow this sequence:
- Upload or collect the weekly exports.
- Check the period, required fields, duplicate deal IDs, and stage labels.
- Calculate agreed KPIs such as pipeline value, conversion, and stale-deal count.
- Ask AI for a comparison and draft, with explicit output rules.
- Review exceptions and publish the final report or dashboard.
The ownership model behind those five steps
| Workflow layer | What can be automated | What still needs an owner |
|---|---|---|
| Source intake | File recognition, schema preview, row and column counts | Confirm the correct file, period, and source owner |
| Data quality | Missing-value scan, duplicate candidates, type inconsistencies | Approve mappings and decide whether an anomaly is valid |
| Calculation | Repeatable formulas and grouped metrics | Define revenue, conversion, margin, and exclusion rules |
| Interpretation | Variance summaries, candidate drivers, chart suggestions | Reject unsupported causes and approve material conclusions |
| Delivery | Report draft, dashboard, downloadable table | Sign off the final number, audience, and action list |
An AI spreadsheet becomes dependable when each layer has an observable output and a named reviewer. “The AI handled it” is not an ownership model.
Use a prompt that creates a review task
Compare this week's qualified pipeline with last week's by source channel.
Show pipeline value, deal count, conversion rate, and week-over-week change.
Flag records with no owner or no activity in 14 days. Draft five leadership
bullets, but separate verified values from possible explanations and list the
exceptions that a sales operations owner must review.
This prompt asks for values, a comparison, a draft, and a review queue. That is much more useful than asking AI to “find insights.”
Where RowSpeak fits
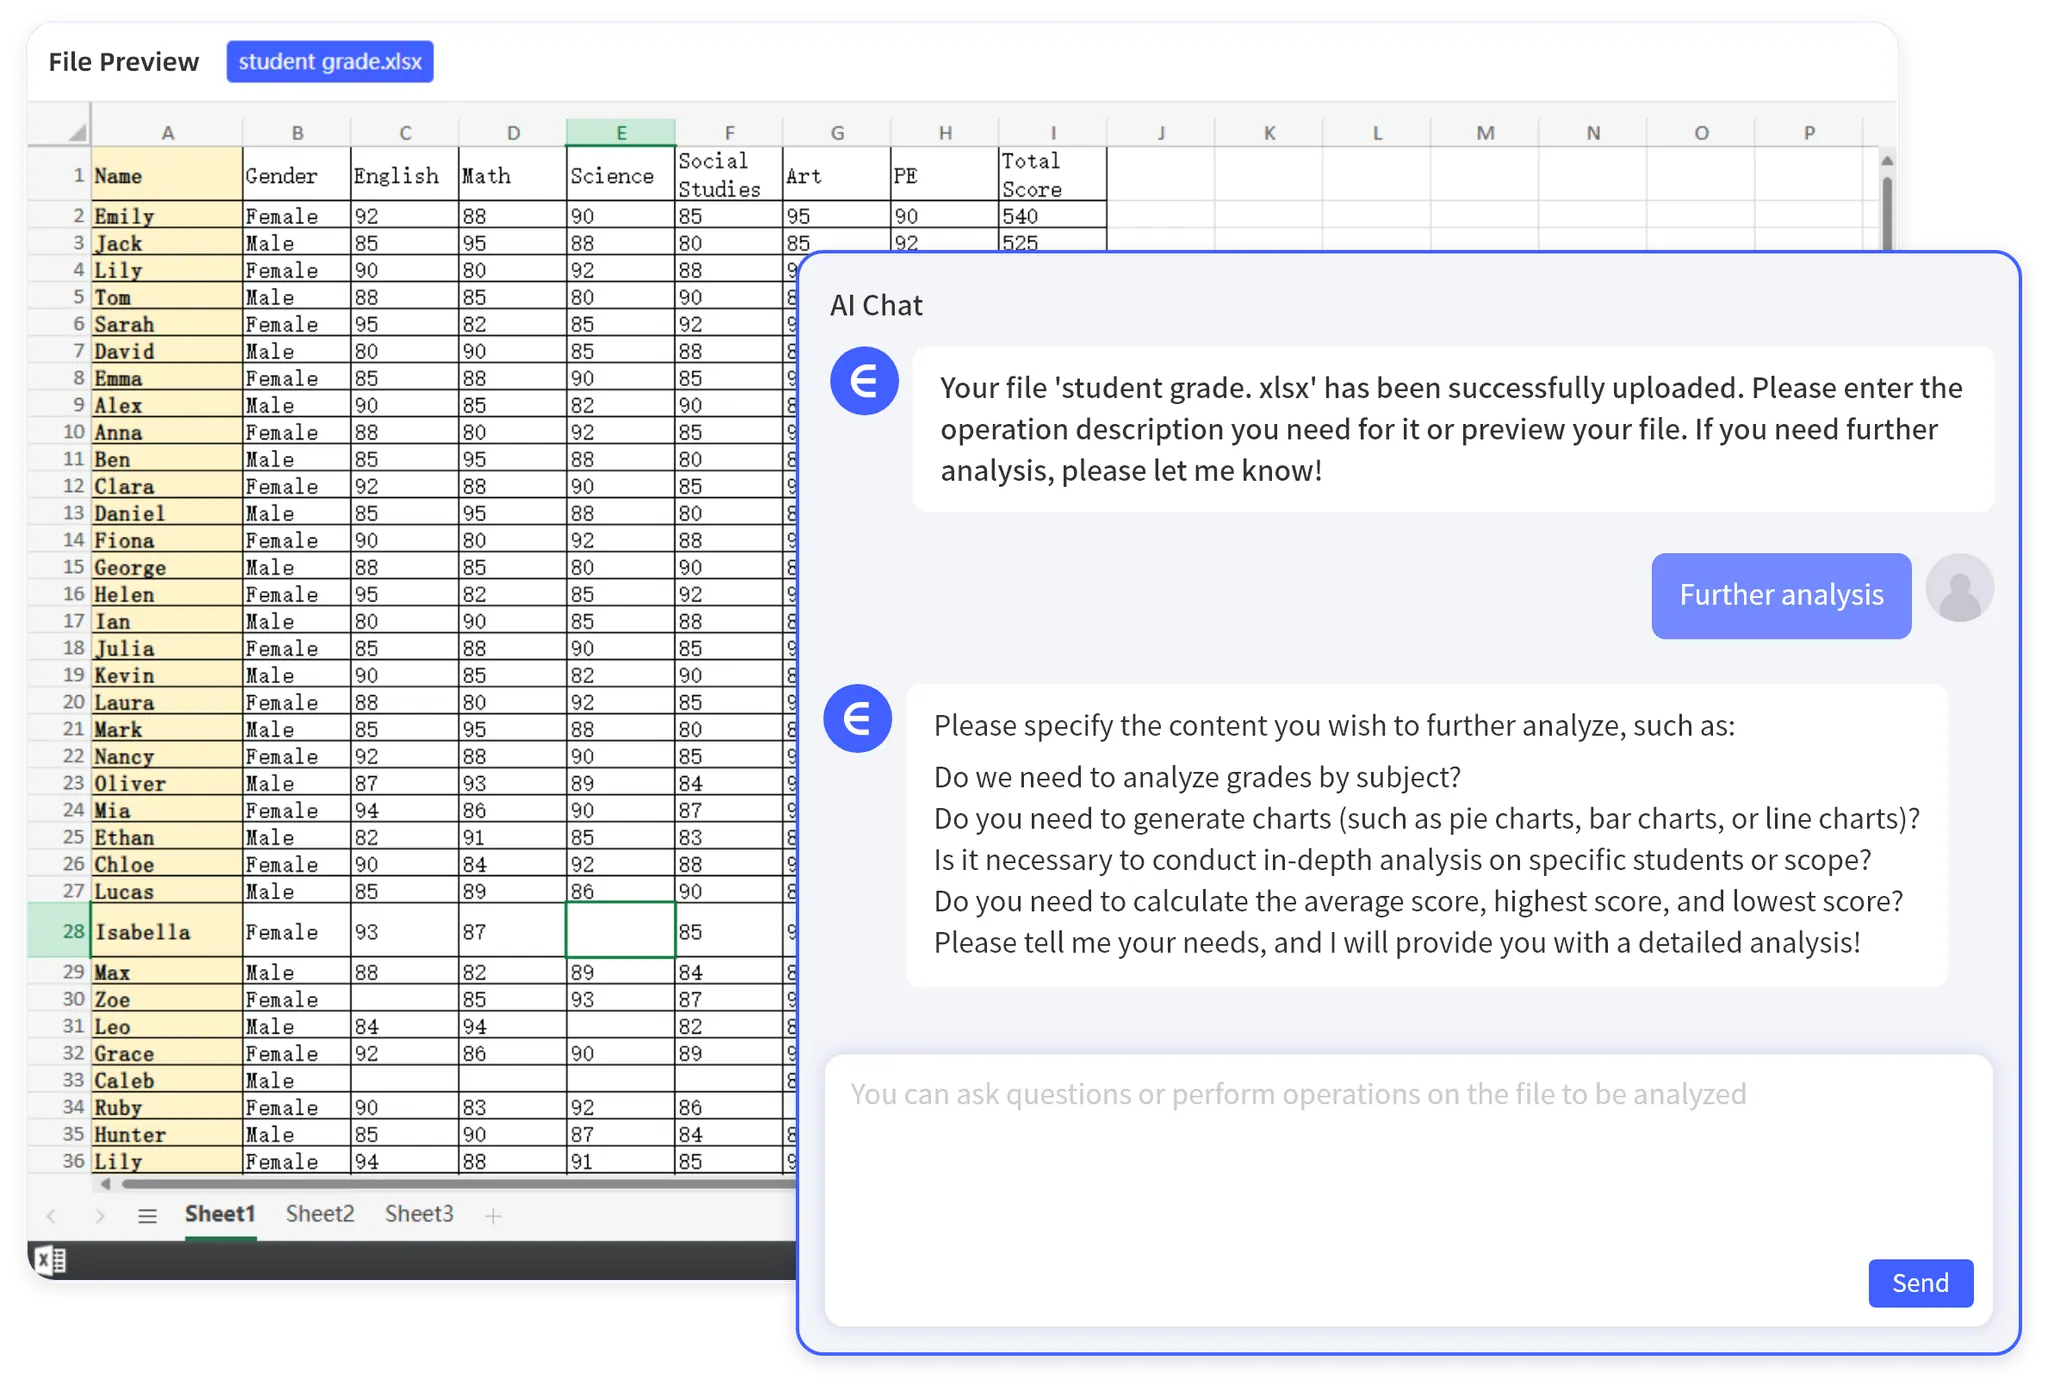
RowSpeak is designed for teams working from real business files: Excel, CSV, PDF, screenshots, image-based tables, and exports. It helps turn those files into answers, reports, and dashboards that people can review and share.
It is not a claim that every workbook should move out of Excel, or that a team should replace a governed BI environment. It is often a practical option when the work is too messy or repetitive for manual spreadsheet analysis but too lightweight for a full BI project.
An Excel AI workflow is a good starting point when your files need more than formula assistance. If the desired output is a leadership update, connect the workflow to AI reporting rather than ending at a chat response.
Four review checks before sharing results
- Source check: Are the intended files and reporting periods included?
- Definition check: Does the metric use the same logic as the prior report?
- Exception check: Are outliers, blanks, and incomplete records visible to a reviewer?
- Decision check: Does the summary name a decision, owner, or next question?
When the answer to any of these is no, return to the file or the metric definition before distributing the output.
Add two adversarial checks for recurring work:
- Change check: Rename a non-critical column or add a new category. Does the workflow preserve the mapping, ask for clarification, or silently change the result?
- Reconciliation check: Can the reported total be tied back to an independently calculated source total and a documented set of exclusions?
These checks catch a common failure mode: an answer that is internally coherent but based on a different slice of the file than the report owner intended.
Start with one recurring question
Do not begin by asking AI to rebuild every spreadsheet. Choose one recurring question that costs the team time each week or month. Define the files, KPIs, output, and review owner. Then use the workflow for two or three cycles and improve the checks after each review.
That is how an AI spreadsheet becomes useful: not by removing accountability, but by removing repetitive work around a decision your team already needs to make.
Start by running the downloadable fixture through the RowSpeak spreadsheet assistant workflow. Keep the first failed output, the corrected prompt, the final artifact, and the reviewer decision together; that evidence is more useful than a polished success screenshot on its own.