Key takeaways:
- Choose RowSpeak if you need to turn Excel, CSV, PDF, screenshots, or exported data into a reviewable analysis, dashboard, or report.
- Choose Sourcetable if you want the closest replacement for an online, AI-enabled spreadsheet workspace.
- Choose Microsoft Copilot in Excel if your team already works in Microsoft 365 and wants AI inside Excel.
- Choose Google Sheets with Gemini if your collaboration and reporting already happen in Google Workspace.
- Choose ChatGPT data analysis if you need flexible, one-off analysis and are comfortable managing the review process yourself.
The right choice depends less on the word “AI” and more on where your work begins and what you need to send at the end: an edited spreadsheet, an answer to a question, or a report your team can review.
Rows alternatives at a glance
| Alternative | Best for | What it replaces | Choose it when | Think twice when |
|---|---|---|---|---|
| Sourcetable | People who want an online spreadsheet with AI | The browser-based spreadsheet workspace | You want to keep working in a grid with formulas and connected data | Your work starts with mixed files and must end in a report-ready package |
| Microsoft Copilot in Excel | Microsoft 365 teams | AI help within an existing Excel workflow | Your workbook is already in Excel and you need editing, formulas, or analysis there | You need to combine exports, PDFs, screenshots, and other files into one report |
| Google Sheets with Gemini | Google Workspace teams | AI help within a shared Sheet | Your team collaborates in Sheets and needs lightweight assistance in that environment | Your process depends on files that do not naturally live in Google Sheets |
| ChatGPT data analysis | Analysts doing flexible, ad hoc work | One-off natural-language exploration | You need to explore an uploaded file, prototype an analysis, or draft an explanation | You need a repeatable report workflow with clear review steps for others |
| RowSpeak | Finance, ops, sales, marketing, and ecommerce reporting | The analysis-and-reporting part of the Rows workflow | You start from real business files and need charts, dashboards, summaries, or reports | Your main job is maintaining one long-lived spreadsheet model or governed BI estate |

1. Sourcetable: best if you want the closest Rows-style spreadsheet
Best for: people who want a browser-based spreadsheet to remain their daily working surface.
Sourcetable is the most natural starting point if what you liked about Rows was the online grid: data in a spreadsheet, formulas and collaboration in the same place, with AI available to help you query or organize it.
Choose Sourcetable if
- You want to replace an online spreadsheet, not only an AI chat experience.
- Your team prefers to import data into a browser-based working sheet.
- Formulas, grid-based organization, and spreadsheet collaboration are still central to the job.
Choose something else if
- You receive a new mix of Excel exports, CSV files, PDF tables, or screenshots every reporting cycle.
- Your stakeholders need a written summary, dashboard, or report—not only a spreadsheet.
- You do not want to move the working data into another spreadsheet environment before answering the question.
What to confirm in user reviews and a trial
Look for feedback from people who use similar files to yours. In particular, test formula compatibility, import quality, how answers trace back to source rows, and whether the final result can be exported or shared in the format your team expects.
2. Microsoft Copilot in Excel: best if Excel is already your home
Best for: teams that live in Microsoft 365 and need AI assistance inside an Excel workbook.
Microsoft's current experience is documented as Edit with Copilot in Excel. It is the first alternative to try when your source is an Excel workbook you are already editing and your desired result is a formula, cleanup step, table change, or explanation inside Excel.
Choose Copilot in Excel if
- Your team is standardized on Microsoft 365.
- The data already lives in a supported Excel workflow.
- You want to edit or analyze a workbook without leaving Excel.
Choose something else if
- Your reporting task starts with several unrelated files.
- You need to turn PDF tables, screenshots, CSV exports, and Excel data into one business narrative.
- You need a report workflow that continues after the workbook edit.
What to confirm in user reviews and a trial
Look for feedback about workbook support, the exact Microsoft 365 plan and setup your organization uses, and how much manual checking is still required after a response. Test your own workbook, especially formulas, dates, tables, and protected or complex sheets.
3. Google Sheets with Gemini: best for Google Workspace collaboration
Best for: teams that already share, edit, and review data in Google Sheets.
Google's Gemini for Workspace is worth evaluating when a shared Sheet is already the center of the workflow. It can be a practical path for spreadsheet assistance, lightweight analysis, and teams that do not want to switch collaboration systems.
Choose Google Sheets with Gemini if
- Your source of truth is already a Google Sheet.
- Your team needs several people to work in the same spreadsheet.
- You want AI help close to your existing Google Workspace process.
Choose something else if
- The question starts outside Sheets, such as with a PDF, a screenshot, or several recurring exports.
- You need a dedicated reporting or dashboard output instead of an updated Sheet.
What to confirm in user reviews and a trial
Use a real shared Sheet and test collaboration, permissions, formula behavior, and how easily a colleague can verify the output. Reviews from teams using only small demo tables will not tell you much about a monthly reporting process.
4. ChatGPT data analysis: best for flexible, ad hoc analysis
Best for: analysts who need to explore a file, test a hypothesis, create a quick chart, or draft an explanation.
ChatGPT data analysis can analyze uploaded files, create tables and charts, and help draft narrative. It is flexible because you can ask a wide range of questions without committing to a new spreadsheet system.
Choose ChatGPT data analysis if
- Your work is exploratory or one-off.
- You want a flexible second opinion on a spreadsheet or CSV export.
- You can state the calculation rules, expected output, and checks clearly in your prompt.
Choose something else if
- The same report must be produced every week or month by different people.
- Your reviewers need an obvious path from the headline to the source fields and calculations.
- You need the final dashboard, report, and follow-up corrections to stay together in one workflow.
What to confirm in user reviews and a trial
The useful question is not only whether the answer sounds right. Test whether the tool identifies the correct columns, follows your date range, applies the calculation rule you specified, and makes it easy to reproduce the result next month.
5. RowSpeak: best for turning business files into a reviewable report
Best for: teams that receive real-world files and need to turn them into an answer, chart, dashboard, summary, or report.
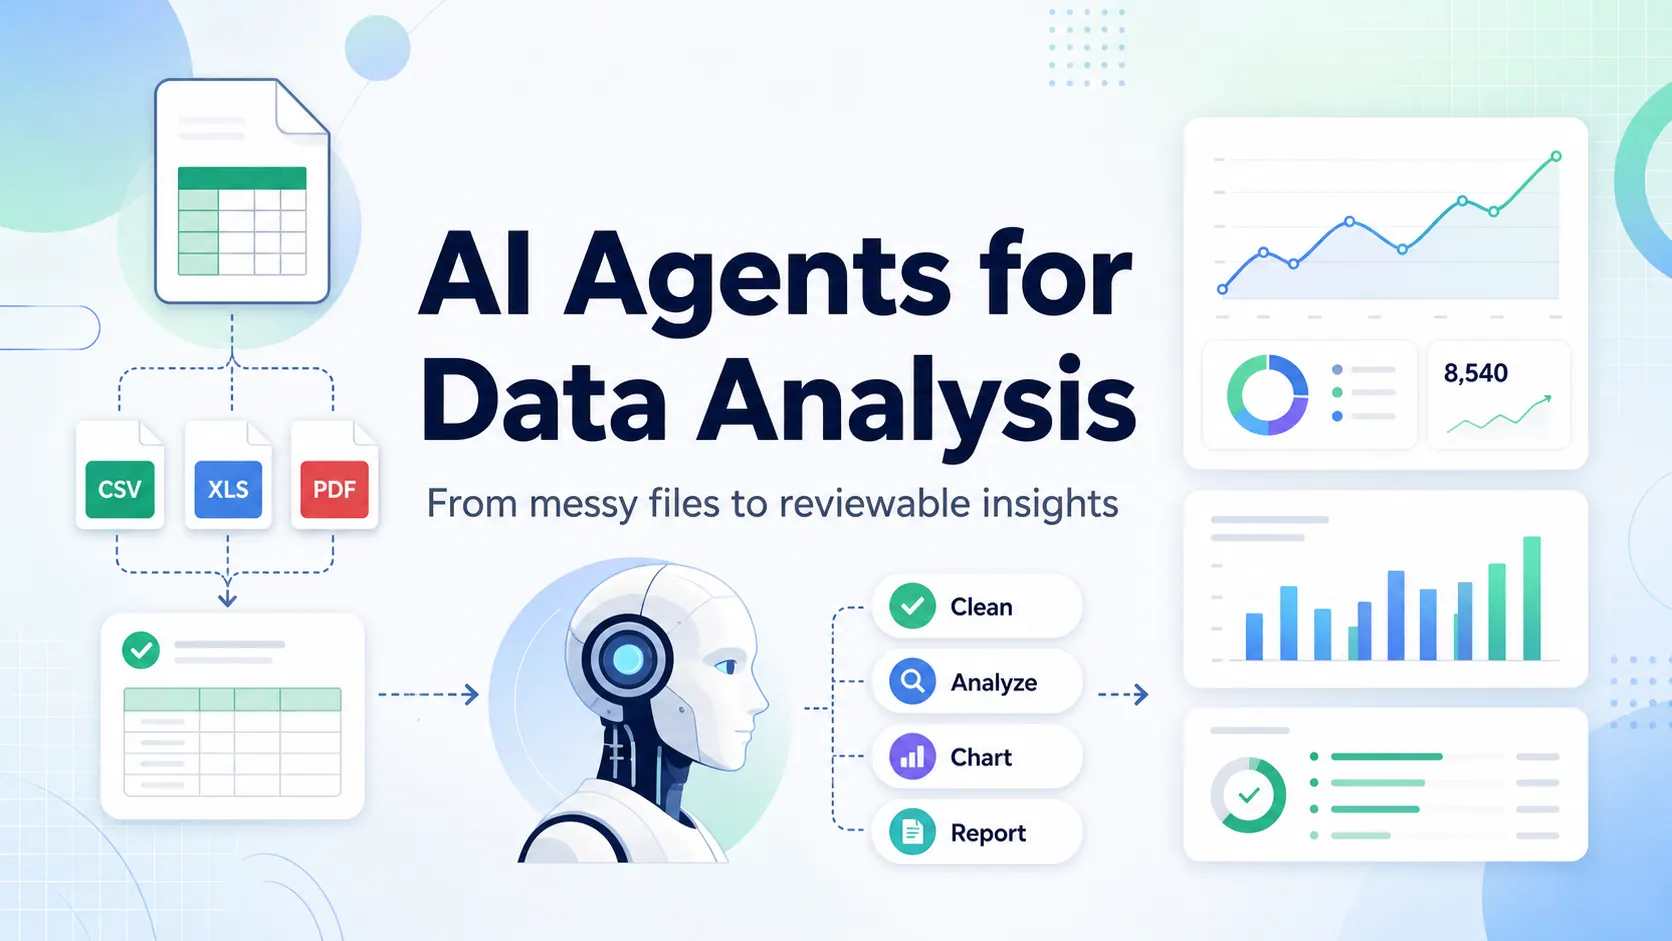
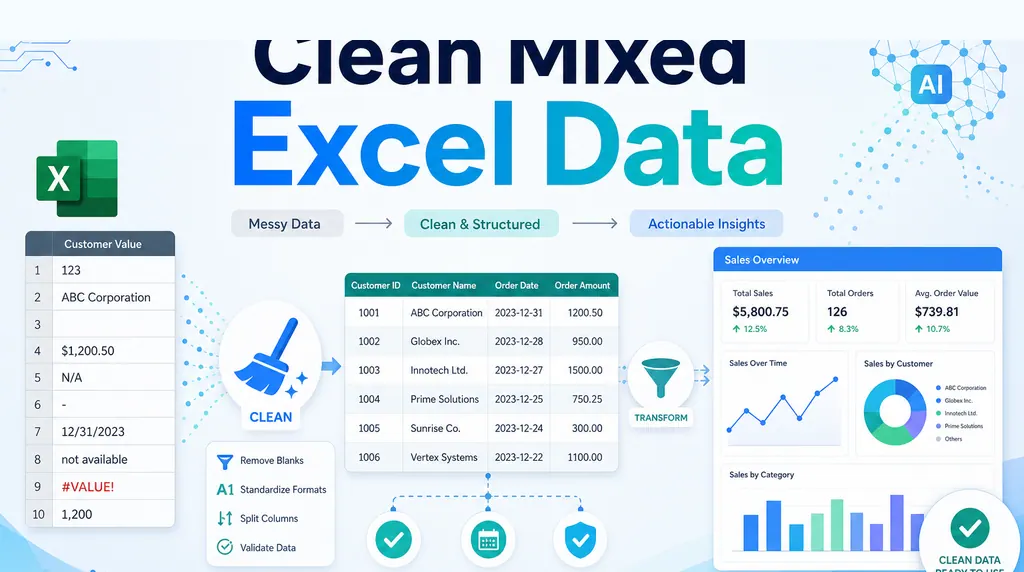
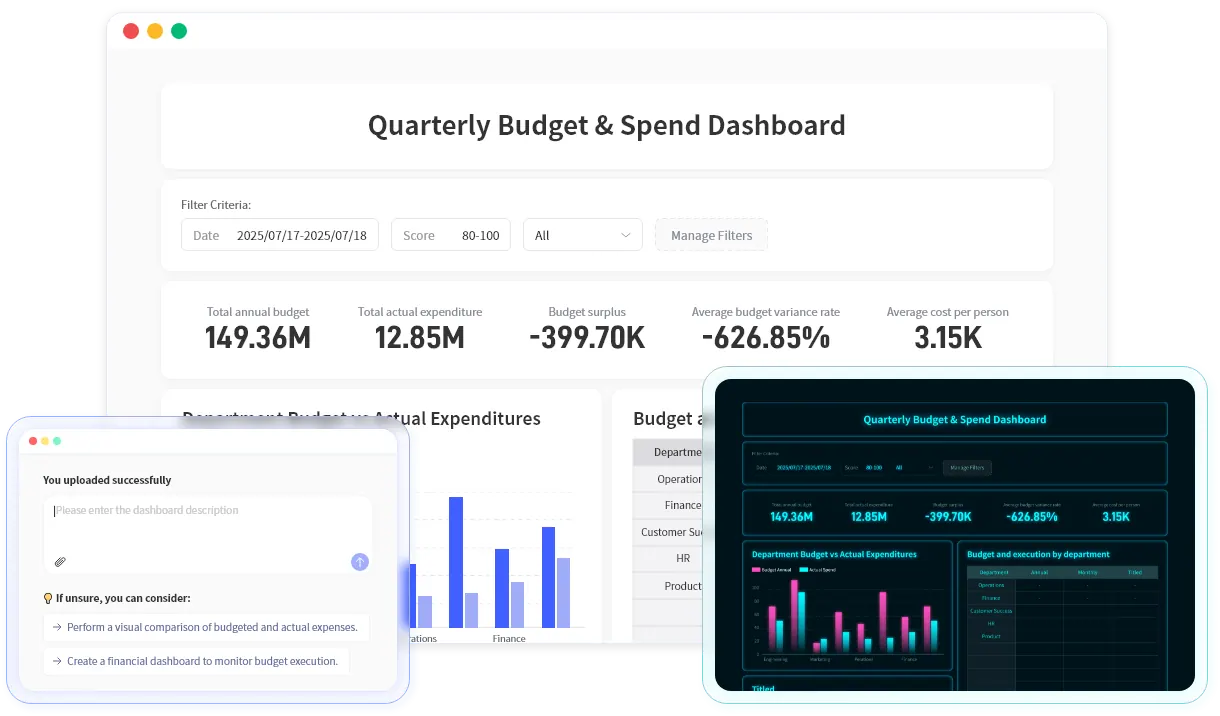
RowSpeak is not another permanent spreadsheet workspace. It is a file-to-report workflow for teams working with Excel, CSV, PDF tables, screenshots, image-based tables, and exported data. You upload the files needed for a task, ask a business question, then review and refine the analysis before sharing it.
Choose RowSpeak if
- You regularly receive Excel exports, CSV reports, PDF tables, or screenshots rather than one clean, long-lived workbook.
- You need to explain what changed, identify exceptions, and create something a manager or client can review.
- You want charts, dashboard-style views, a written summary, and follow-up corrections in the same analysis workflow.
Choose something else if
- You mainly need to maintain formulas, cells, and formatting inside a single workbook.
- Your report already needs scheduled refresh, formal governance, stable metric definitions, and organization-wide access control. In that case, assess BI alongside spreadsheet tools.
What a RowSpeak workflow looks like
The video below shows the product interface generating a chart from an analysis conversation. It is a product demonstration, not an independent customer review.
For example, a finance team can upload actuals, budget, and a supporting vendor table, then ask:
Compare June actual operating expense with the Q2 budget by department.
Include the vendor adjustments, flag categories more than 10% over plan,
show the five largest drivers, create one chart, and draft a short management summary.
List the source fields and assumptions I should verify before sharing.
After the first result, review the date range, currency, column mapping, excluded rows, and variance definition. If any assumption is wrong, correct it before using the output. This is where a file-to-report workflow differs from getting a single chat answer.
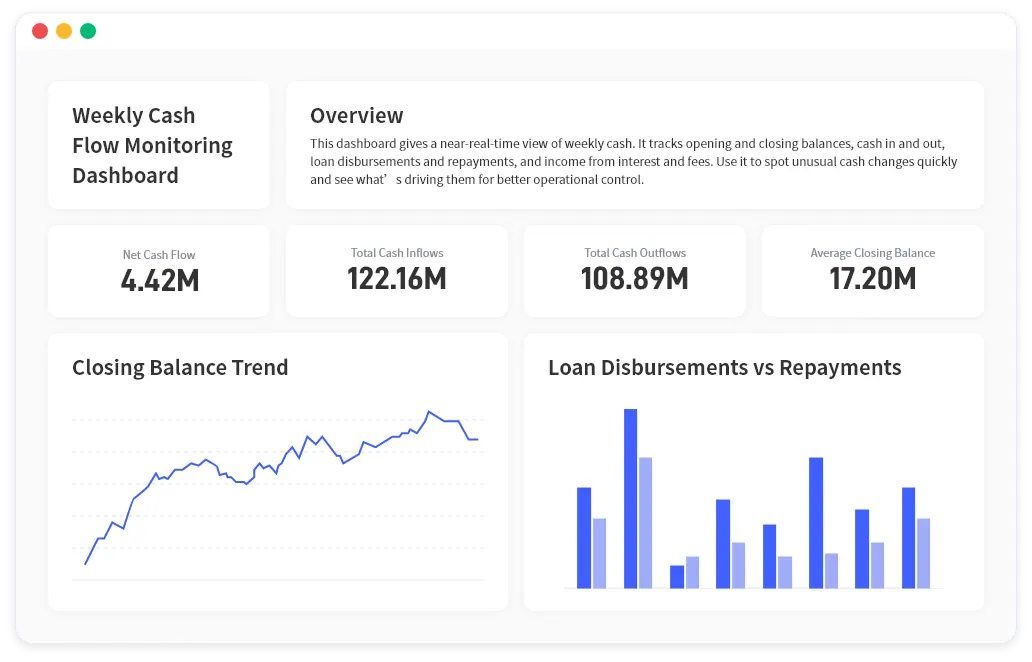
The next demo shows a completed dashboard with charts and written performance findings from an uploaded report. Again, use it to evaluate the workflow—not as evidence that it will produce the same result for every file.
For more detail, see the Excel AI workflow, AI reporting feature, and Excel-to-dashboard workflow.
How to choose in 15 minutes
Use one real, non-sensitive export from a recurring task. A monthly sales CSV, a budget-versus-actual workbook, or a campaign report is better than a polished demo file.
- Name the final deliverable. Do you need an edited workbook, a shared spreadsheet, a quick answer, a dashboard, or a management report?
- Run the same question in each shortlist tool. Include the period, grouping, calculation rule, expected chart, and intended reader.
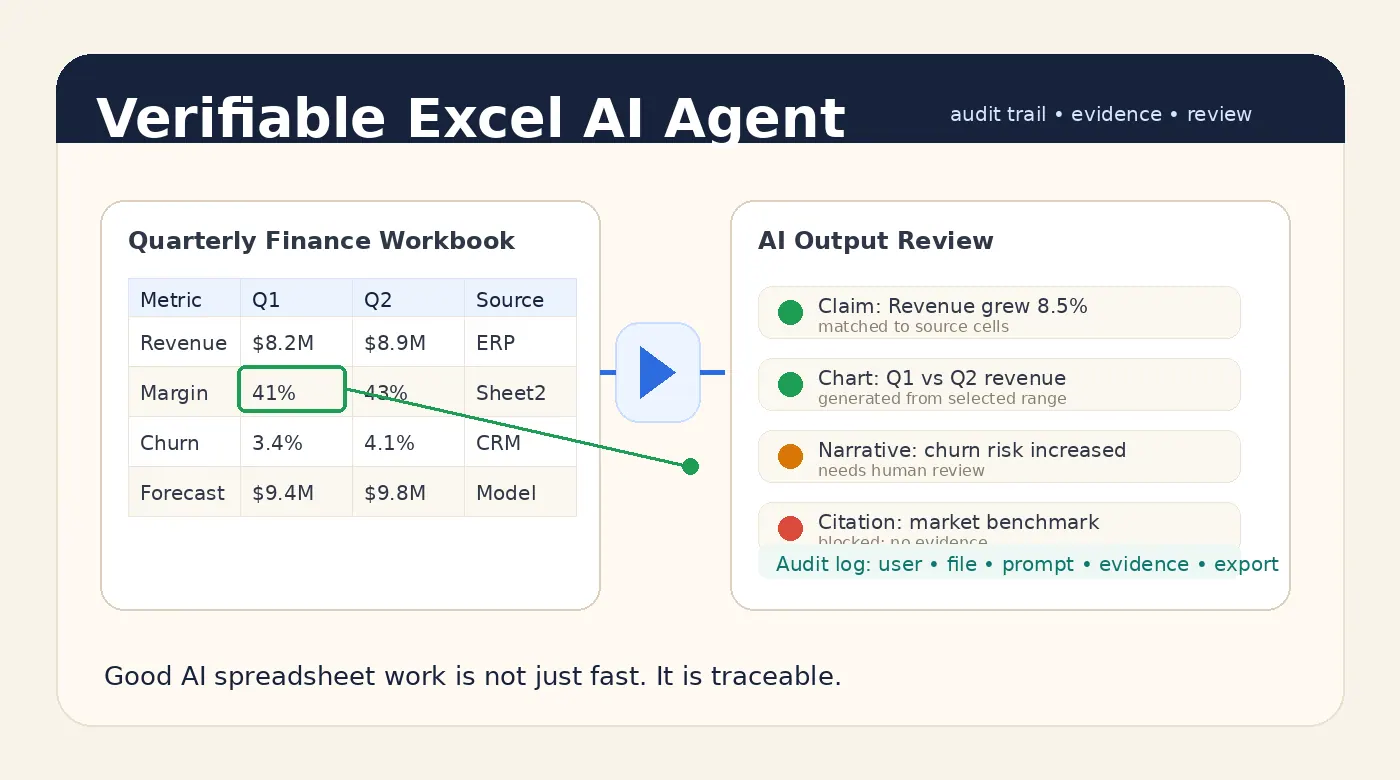
- Check the evidence. Confirm rows, columns, dates, currencies, exclusions, and totals before judging the prose.
- Make one correction. Change a grouping or date range. The tool should make the correction understandable rather than start the analysis from scratch.
- Ask a colleague to review the result. If they cannot tell where the figures came from, the workflow is not ready for recurring use.
What user feedback should you trust?
Star ratings and short quotes are useful only when the reviewer has the same job, files, and reporting pressure as you. A positive review from a user who only needed a formula is not strong evidence for a finance team preparing a month-end report.
When you read independent reviews, community discussions, or references from a vendor, look for these concrete details:
| If your job is… | Look for feedback that mentions… | Treat this as a warning sign |
|---|---|---|
| Spreadsheet collaboration | Formula compatibility, editing conflicts, sharing, and import reliability | “It looks like Excel” with no detail about the actual workbook |
| Finance or operations reporting | Source fields, calculations, exception checks, exports, and review | A polished dashboard with no explanation of where the numbers came from |
| Sales or marketing analysis | CRM/ad-platform exports, date comparisons, charts, and summary quality | A generic AI answer that cannot be updated for the next reporting period |
| Sensitive-file workflows | Approved data boundary, retention, access, and review policy | A claim of “secure” without a clear deployment or governance discussion |
This article deliberately does not publish an uncited live review score or anonymous testimonial as fact. Review availability, product plans, and ratings change. Use the official documentation linked above, watch the product demos, and validate the candidates with your own reporting file before making a migration decision.
The best Rows alternative for your next task
If you want another online spreadsheet, start with Sourcetable. If you must stay inside Excel or Google Sheets, test the AI in the suite your team already uses. If you need flexible exploration, test ChatGPT with a clear review checklist.
If your job starts with messy exports and ends with a chart, dashboard, summary, or report that other people need to trust, try the RowSpeak Excel AI workflow on one representative, non-sensitive file.
Rows is a trademark of its respective owner. RowSpeak is an independent product and is not affiliated with Rows. Product capabilities, prices, ratings, and availability change; verify them with the relevant vendor before purchasing.