Key takeaways:
If you finish this guide, you will have a simple process for turning a folder of quarterly exports into one report your manager or board can understand:
- You will know how to spot the three problems that make combined CSV totals unreliable: different column names, different date or currency formats, and duplicate or missing rows.
- You will get copy-and-paste prompts for checking files, calculating budget and prior-quarter variance, and finding the teams or accounts behind the change.
- You will see what a useful board report contains: a short answer first, evidence behind the answer, and a visible list of items that still need review.
- You will learn how RowSpeak can take Excel, CSV, PDF, or image-based tables through one workflow: upload, clean, analyze, create a report, and share one reviewable link.
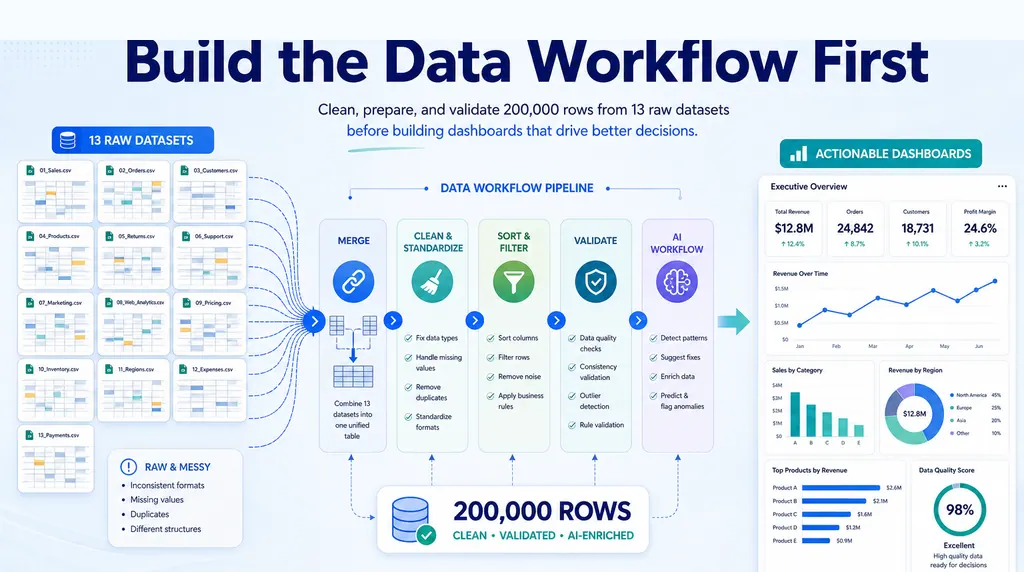
Quarterly reporting rarely starts with one clean workbook. Finance and operations teams usually receive a folder of CSV exports: one file per month, region, business unit, or system. A vendor may send a PDF statement as well. Before the board sees a trend, someone has to reconcile headers, dates, currencies, categories, duplicates, and missing rows.
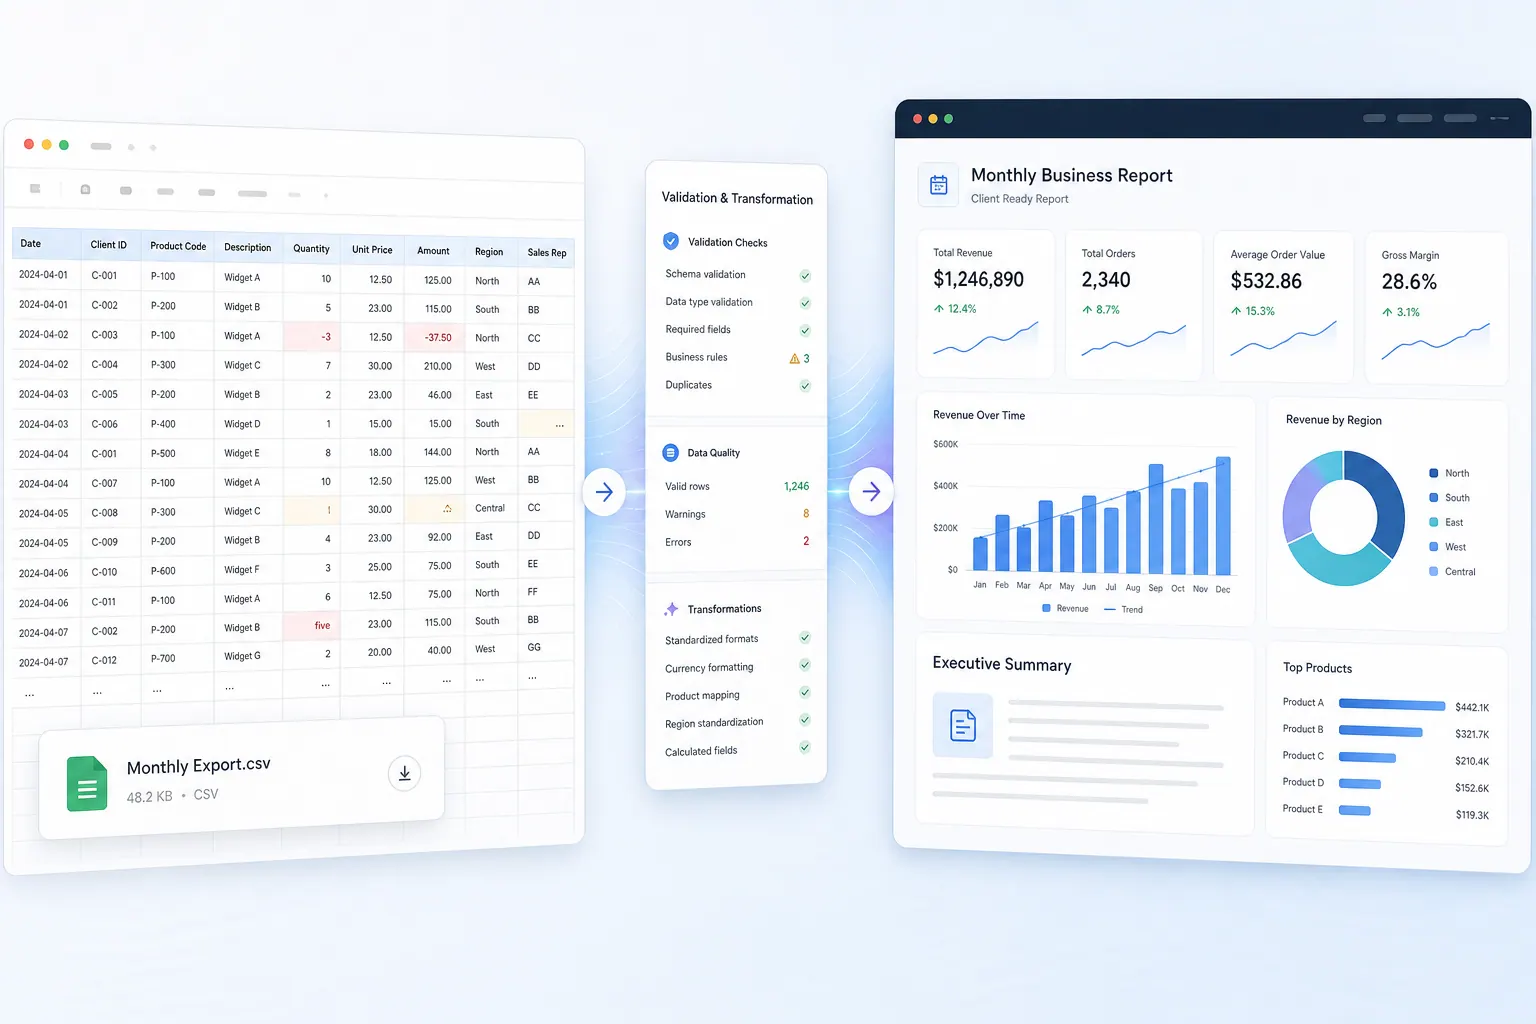
This guide shows a repeatable path from those messy files to a reviewable management report: import, clean, analyze, write, and share. The goal is not to remove finance judgment. It is to spend less time repairing files and more time explaining what changed and what the business should do next.
Why quarterly CSV reporting breaks
CSV is useful because almost every finance system can export it. It is not a finished report. The same field may be called Amount, Net Amount, or Total across files. One month may use 2026-04-30, another 04/30/2026. A regional file may report in EUR while the group file expects USD. A PDF from a bank or vendor may contain the only missing detail. If this sounds like your normal reporting folder, the Excel AI workflow explains how to work with these files without learning code.
The spreadsheet community has described this broader problem for years. In the Hacker News discussion “Spreadsheets Are All You Need”, the appeal of spreadsheets is clear: they are familiar, flexible, and general-purpose. The limitation is equally familiar: a general-purpose grid does not automatically provide a dependable import, cleanup, analysis, report, and sharing workflow.
That distinction matters for finance. A board-ready report must answer three questions: what happened, why did it happen, and what needs attention? A raw CSV answers none of them on its own.
Step 1: Define the reporting package before importing files
Write down the expected output first. For a quarterly finance report, that might include:
- revenue, gross margin, operating expense, and cash metrics;
- quarter-over-quarter and budget variance;
- the largest positive and negative drivers by business unit or account;
- an exceptions table for missing, duplicate, or out-of-period records;
- a short executive summary and a report view that can be shared.
This list becomes a test for every transformation. If a cleanup step does not help produce or validate one of these outputs, it probably does not belong in the first pass.
Step 2: Import the quarter as a file set
Upload the monthly CSVs together and identify what one row represents in each file: invoice, invoice line, payment, expense transaction, or budget line. Do not combine them until that meaning matches. For example, mixing invoice lines with invoice totals can count the same revenue twice. The finance AI for Excel workflow covers more examples of finance files and analysis tasks.
Ask for an import inventory before analysis:
Review these quarterly finance files before combining them. For each file, report:
1. row count and date range;
2. column names and likely meaning;
3. currency and unit conventions;
4. duplicate keys, blank required fields, and subtotal rows;
5. columns that do not match across files.
Do not calculate KPIs yet. Return a reconciliation table and list questions that require finance confirmation.
If a PDF statement or scanned table is part of the quarter, include it in the same review. PDF extraction remains a common manual bottleneck because page layout does not reliably preserve table structure. Extracted rows still need checks for repeated headers, split rows, page totals, and signs before they are merged with CSV data.
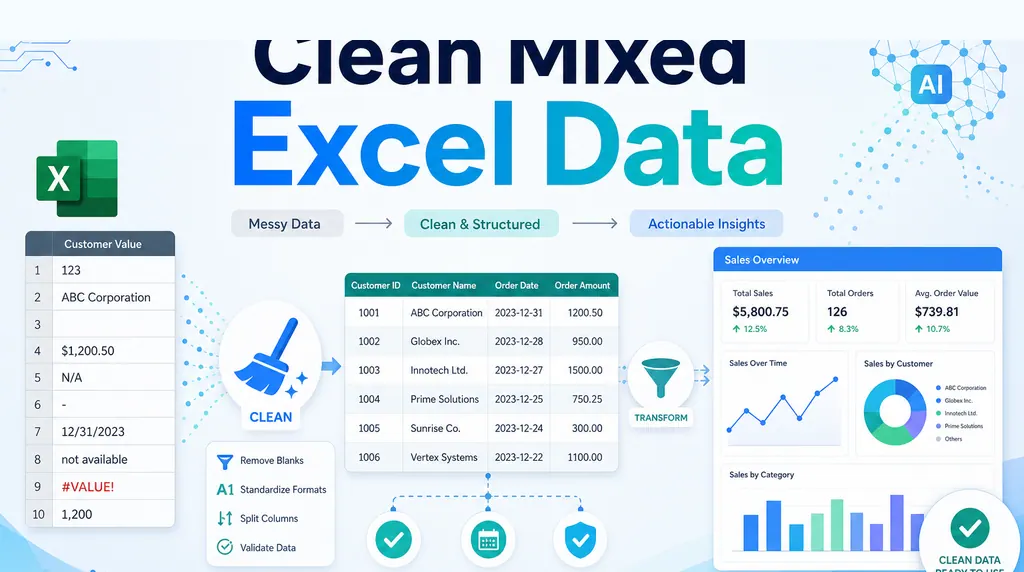
Step 3: Clean formats without hiding the rules
Apply only changes that are explicit and reversible:
- Standardize header names and trim whitespace.
- Parse dates using one timezone and one quarter definition.
- Convert numeric strings, parentheses, and thousands separators consistently.
- Normalize currency and document the conversion rate or source.
- Map category variants such as
Ops,Operations, andOperationsto one controlled label. - Remove exact duplicates only after identifying the duplicate key.
- Separate subtotals and notes from transaction rows.
Keep a cleaning log with the rule, affected row count, and unresolved items. For example: “12 rows had blank cost centers; retained in the exception table.” A polished total is not trustworthy if nobody can explain what was removed to produce it.
The short demo below shows RowSpeak cleaning a spreadsheet inside the same conversation used for analysis. This helps avoid copying the cleaned data into another tool before you can continue.
Step 4: Run standard quarterly analysis
Once the combined table passes validation, run the same analysis each quarter. A useful baseline includes:
- actual versus budget and prior quarter;
- absolute and percentage variance;
- contribution by business unit, region, account, or product;
- margin and expense-rate movement;
- top five positive and negative drivers;
- outliers and records that need review.
Use guardrails for percentage variance. If the prior-period value is zero or close to zero, report the absolute change and label the percentage as not meaningful instead of manufacturing an infinite growth rate.
Example prompt:
Using the cleaned quarterly table, calculate actual, budget, prior-quarter actual,
absolute variance, and percentage variance for revenue, gross margin, and operating
expense. Rank the five largest drivers by business unit and account. Flag zero-base
comparisons, missing dimensions, out-of-period dates, and any total that does not
reconcile to the source files. Show the formulas and assumptions before writing conclusions.
Step 5: Turn analysis into a board-ready report
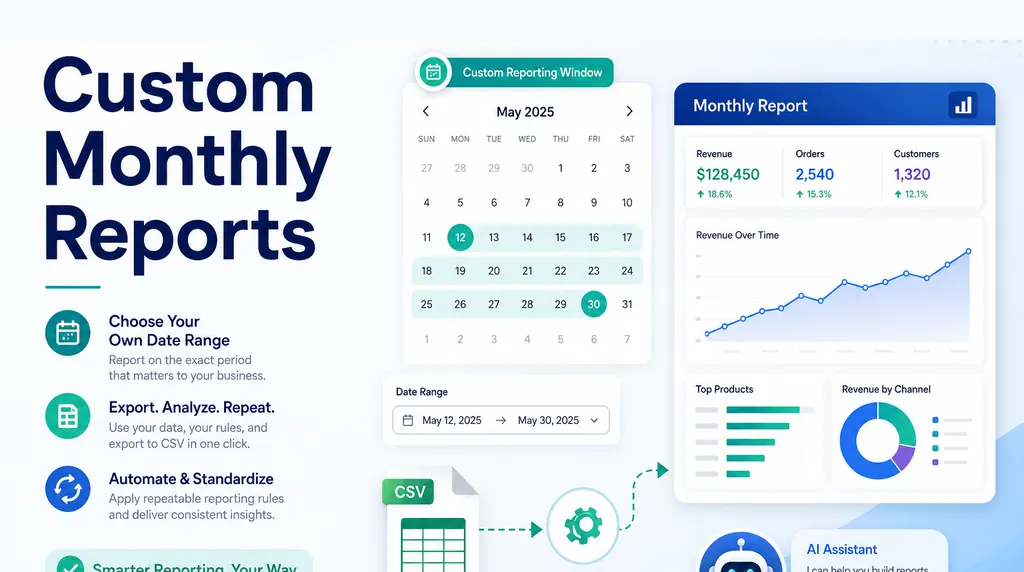
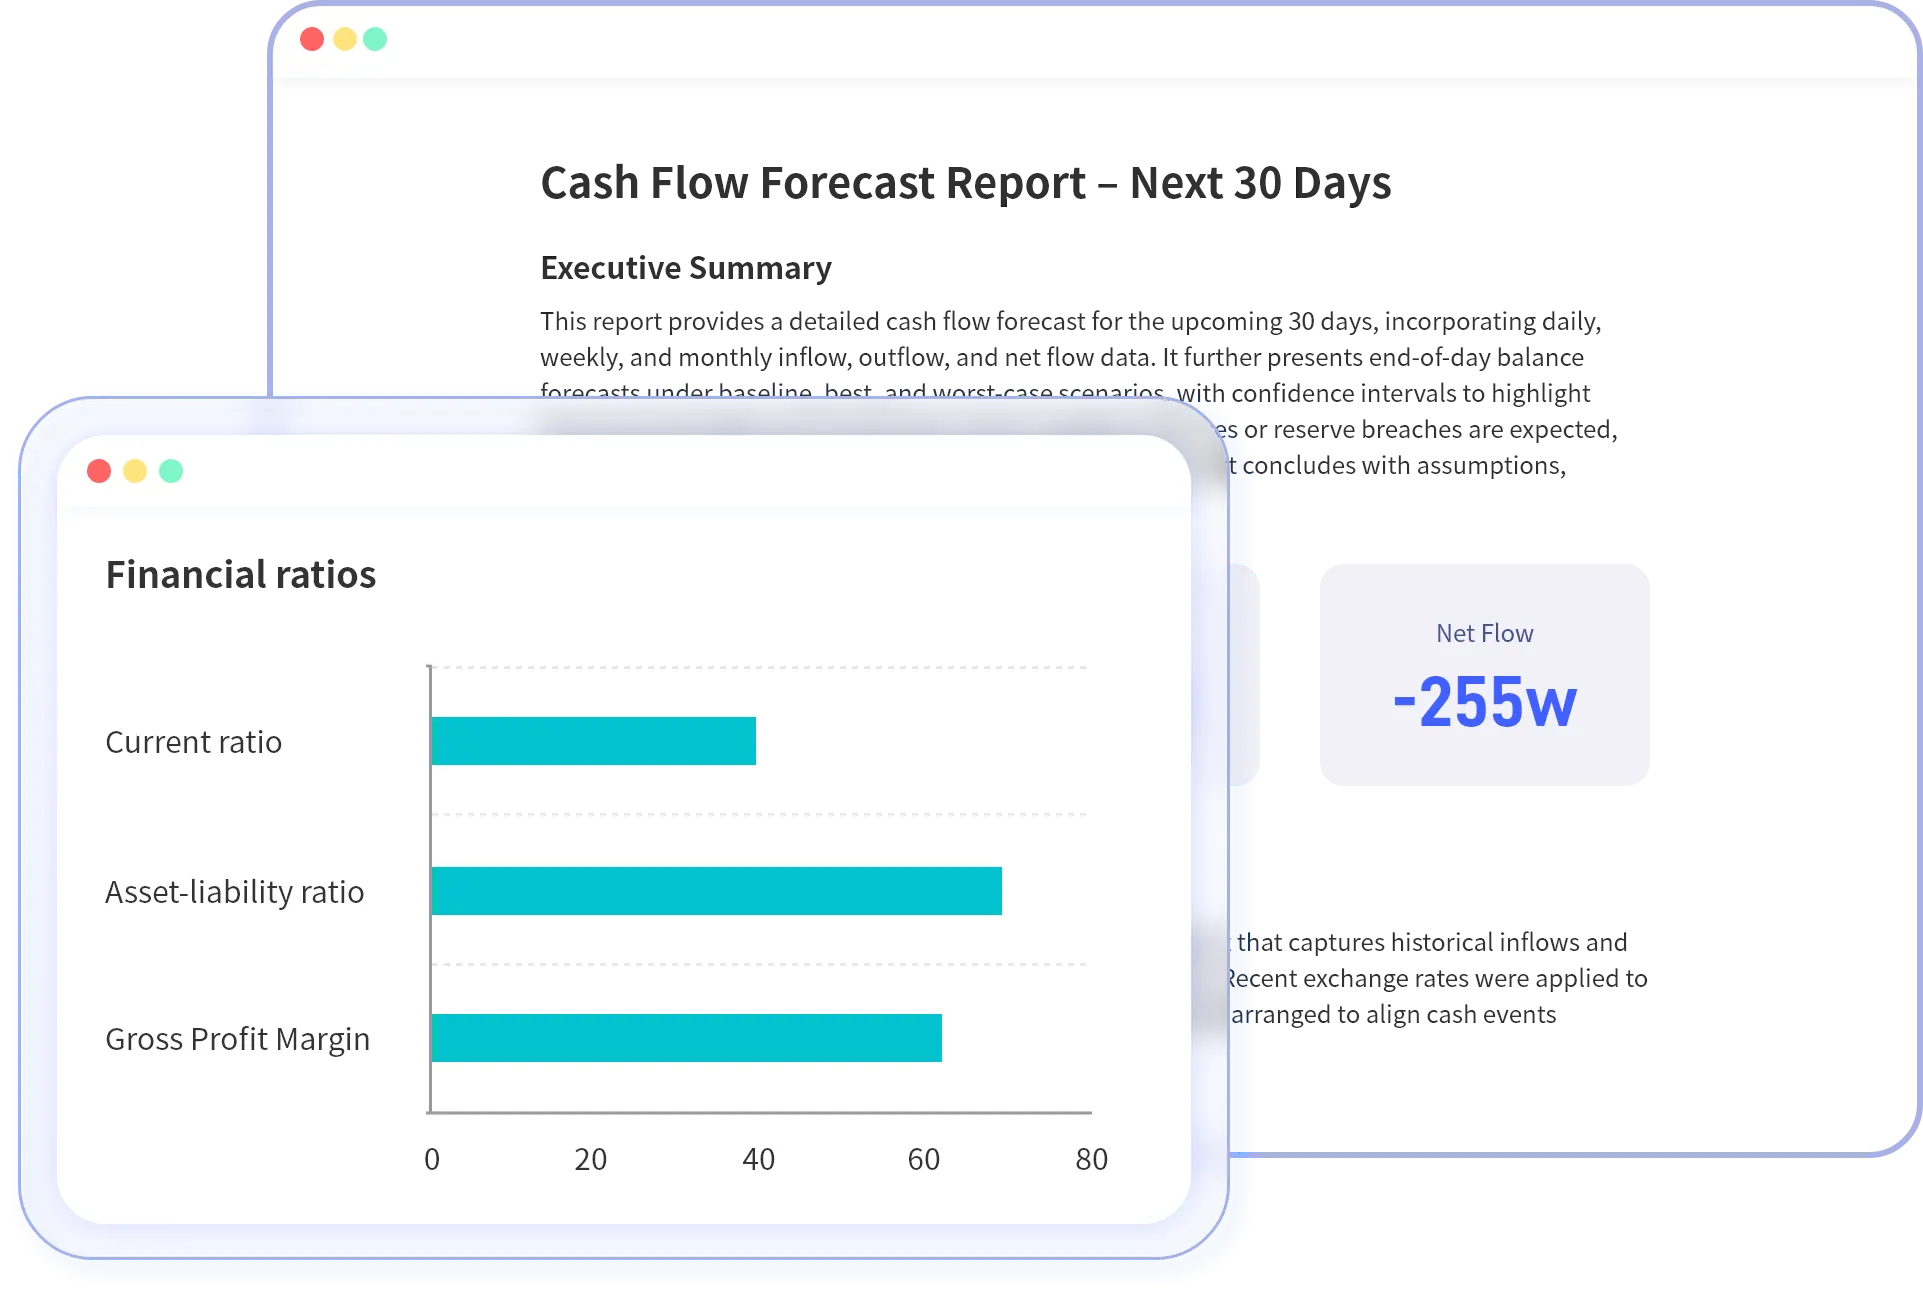
The report should lead with the answer your manager needs, not a history of how the files were prepared. RowSpeak's management reporting workflow uses the same approach: show the main result first, then provide the numbers behind it. A compact structure works well:
- Executive summary: three to five bullets naming the result, drivers, risks, and next action.
- KPI view: current quarter, prior quarter, budget, and variance.
- Driver analysis: ranked chart or table with the business dimensions behind movement.
- Exceptions and assumptions: unresolved rows, mapping decisions, and data-quality limits.
- Appendix: detailed transactions or reconciliation evidence for reviewers.
Write the summary after the calculations. A sentence such as “Operating expense was 8% over budget, concentrated in two cost centers, while revenue was on plan” is more useful than “The quarter showed mixed performance.”
Step 6: Review, then share one version
Before distribution, reconcile report totals to the source files, inspect the largest variances, verify the quarter boundary, and ask an owner to approve business definitions. Check that charts use the same filters as KPI cards. If a PDF extraction supplied rows, spot-check those rows against the original pages.
Then share a report view or link rather than emailing multiple workbook copies. One reviewable version keeps comments, assumptions, and follow-up questions attached to the same analysis. If leadership prefers a visual summary, the Excel-to-dashboard workflow explains how to turn the final numbers into clear KPI cards and charts.
The video below shows a spreadsheet-based quarterly reporting task becoming a finished report output.
Where RowSpeak fits
RowSpeak is built for the gap between raw business files and a finished report. You can import Excel, CSV, PDF, screenshots, or image-based tables, ask for cleanup and reconciliation in plain English, run repeatable analysis, generate a report or dashboard view, and share the result. That continuous workflow is useful when Excel is too manual, a generic chat tool is too detached from the file, and a full BI implementation is more infrastructure than the quarterly question requires.
It does not remove the need for finance review. It makes the reviewable work visible: source files, transformations, assumptions, calculations, exceptions, and the report that follows from them.
If your next board pack starts with a folder of exports, begin with the import inventory prompt above. Then move through cleanup, variance analysis, report writing, and sharing as one workflow. You can explore the AI reporting workflow for ready-to-send summaries and reports, then try RowSpeak with anonymized files your team already uses.
FAQ
Can I combine CSV and PDF data in one quarterly report?
Yes, provided the extracted PDF table is checked for shifted columns, repeated headers, missing rows, and totals before it is combined with CSV records.
Should every CSV be cleaned in the same way?
Use shared rules for dates, numbers, currencies, and controlled categories, but keep source-specific mappings and exceptions documented rather than forcing incompatible fields together.
Is this a replacement for Excel or BI?
No. Excel remains useful for detailed review, and BI is valuable for governed, recurring models. RowSpeak fits when teams need to move quickly from mixed files to analysis, a report, dashboard-style output, and a shareable review link.
Your next quarterly report can start here
You do not need to redesign your finance stack to test this workflow. Pick one recurring report, remove names or other sensitive details, and upload the CSVs, Excel files, or PDF tables you already have. Ask RowSpeak to check the files first, then continue with cleanup, variance analysis, an executive summary, and a shareable report view.
Start with one real reporting question: “What changed this quarter, what caused it, and what should leadership review?”
Turn your next export into a reviewable report → Try RowSpeak